In early 2026, Bitcoin (BTC) has evolved from a speculative asset into a cornerstone of the global digital financial architecture. This analysis provides an institutional-grade outlook on the fundamental, technical, and macroeconomic drivers for the 2026 fiscal year.
Bitcoin 2026: A Comprehensive Fundamental and Macro Outlook
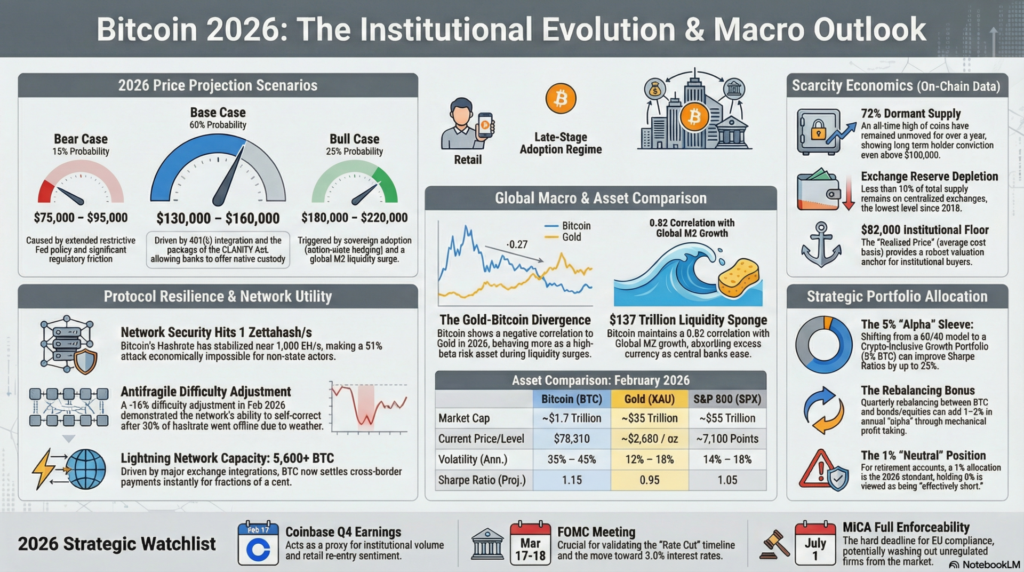
As of Q1 2026, Bitcoin has transitioned into a “Late-Stage Adoption” regime. The extreme volatility of the 2017 and 2021 cycles has dampened, replaced by structural institutional flows. Following the 2024 halving, the supply-side crunch is now fully manifesting as exchange reserves reach multi-year lows.
Investment Thesis: Bitcoin is the primary “asymmetric hedge” against global fiat debasement. In 2026, its value is driven not by retail hype, but by its integration into the $22 trillion U.S. retirement market and its role as a neutral reserve asset for AI-driven commerce.
2. Bitcoin Architecture & Product Analysis
The fundamental value of Bitcoin is rooted in its “Product” characteristics: a predictable, immutable, and secure protocol.
Protocol Resilience
Proof of Work (PoW): Bitcoin’s security budget remains the highest in history. The Hashrate has stabilized near 1 Zettahash per second (1,000 EH/s) in early 2026, making the cost of a 51% attack economically impossible for any non-state actor.
Difficulty Adjustment: The network’s ability to self-correct was tested in February 2026, when severe weather in North America took 30% of the hashrate offline. The subsequent -16% difficulty adjustment demonstrated the network’s “antifragile” nature.
Scalability: The Lightning Era
Network Capacity: Lightning Network capacity has surpassed 5,600 BTC, driven by exchange integration (Binance, Coinbase, Kraken).
The “Invisible” Layer: In 2026, users often interact with Bitcoin via Layer 2 without knowing it. Payments settle instantly for fractions of a cent, making BTC a viable competitor to the SWIFT and Visa rails for cross-border settlement.
3. Fundamental Analysis (On-Chain & Supply)
Fundamentals in 2026 focus on “Scarcity Economics” and “Wallet Maturity.”
Supply Dynamics
Post-Halving Crunch: The daily issuance remains at 450 BTC. In 2026, “Dormant Supply” (coins unmoved for 1+ year) has reached an all-time high of 72%, indicating that long-term holders are not selling even as prices cross $100,000.
Exchange Depletion: BTC held on centralized exchanges has dropped below 10% of total supply, the lowest level since 2018.
Valuation Frameworks
Realized Price Bands: Historically, Bitcoin finds strong support at its “Realized Price” (the average price at which all coins last moved). In 2026, this floor sits near $82,000, providing a robust “valuation anchor” for institutional buyers.
4. Technical Analysis Framework (BTCUSD)
Professional traders in 2026 use a combination of liquidity maps and on-chain confluence.
Market Regime: BTC is currently in a Bullish Consolidation phase. The 200-day Moving Average (DMA) is sloping upward, acting as the primary trend filter.
Liquidity Gaps: A significant liquidity gap exists between $85,000 and $92,000. Analysts expect this zone to be tested and held before a push toward new All-Time Highs (ATH).
Derivatives Confluence: Open Interest (OI) in CME Bitcoin Futures remains high, but “Funding Rates” are neutral. This suggests the market is not over-leveraged, reducing the risk of a “liquidity cascade” or “flash crash.”
5. Global Macro & Economic Data Impact
Bitcoin’s 2026 performance is tightly correlated with Global M2 Liquidity.
The “Liquidity Sponge” Effect
M2 Money Supply: Global M2 has surged to over $137 trillion. As central banks ease to manage sovereign debt, Bitcoin acts as a “liquidity sponge,” absorbing the excess currency.
The Fed Pivot: With U.S. interest rates drifting toward the 3.0% – 3.25% range in 2026, the “opportunity cost” of holding a non-yielding asset like Bitcoin has vanished, inviting capital back from “risk-free” money market funds.
Economic Announcements to Watch
FOMC Meetings: Any shift in the “Dot Plot” toward further easing.
CPI/PCE Data: Sticky inflation confirms the “Store of Value” thesis.
Employment (NFP): Weak labor data often triggers expectations of “Quantitative Easing” (QE), which is historically bullish for BTC.
6. Integrated 2026 Forecast Model
The Base Case: “The Institutional Grind”
Price Target: $145,000.
Logic: Steady ETF inflows ($35B+ annually) combined with the Q2 passage of the CLARITY Act in the U.S. allows banks to offer native custody, unlocking a new wave of capital.
The Bull Case: “Sovereign Supply Shock”
Price Target: $210,000.
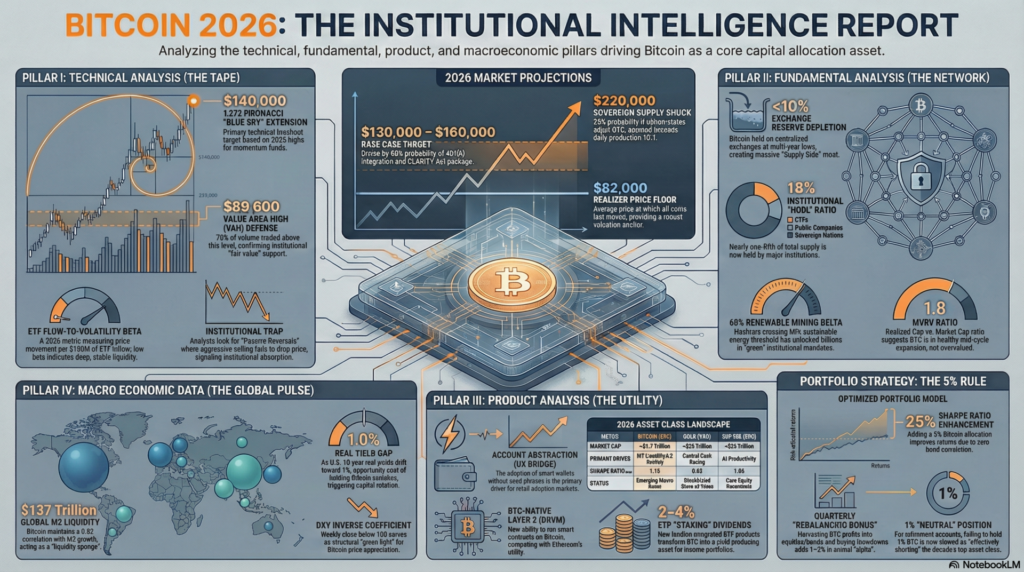
Logic: At least two additional nation-states follow the “El Salvador model” to hedge against USD volatility. This, combined with a “Supply Shock” where demand exceeds daily mining production by 10:1.
7. Risk Analysis & Strategic Considerations
Despite the bullish outlook, three primary risks remain in 2026:
Quantum Concerns: Speculative fears regarding quantum computing’s impact on SHA-256 (though mathematically distant, it affects sentiment).
ETF Centralization: BlackRock and Fidelity now control ~10% of supply; a sudden change in redemption policy could trigger volatility.
Regulatory “Chokepoint 3.0”: While laws are clearer, aggressive enforcement on “self-custody” remains a tailwind for volatility.
Final Conclusion
In 2026, Bitcoin has matured into a Senior Alternative Asset. The 4-year cycle is likely “lengthening” or “flattening” as institutional rebalancing replaces retail FOMO. For the professional allocator, Bitcoin is no longer a “bet” on technology, but a “position” on the future of global liquidity.
To finalize our 2026 outlook, the following comparative valuation table places Bitcoin within the context of the broader financial system as of February 2026. This data reflects a market where gold has recently surged as a “crisis hedge” while Bitcoin and the S&P 500 navigate a complex “risk-on” consolidation.
2026 Asset Class Comparison: Bitcoin vs. Gold vs. S&P 500
Metric
Bitcoin (BTC)
Gold (XAU)
S&P 500 (SPX)
Market Capitalization
~$1.7 Trillion
~$35 Trillion
~$55 Trillion
Current Price / Level
$78,310
~$2,680 / oz
~7,100 Points
YTD Performance
-10.2%
+7.8%
+0.5%
Primary Driver
M2 Liquidity & L2 Scaling
Central Bank Buying
AI Productivity Gains
2026 Volatility (Ann.)
35% – 45%
12% – 18%
14% – 18%
Correlation to BTC
1.00
-0.27 (Negative)
+0.45 (Moderate)
Sharpe Ratio (Proj.)
1.15
0.95
1.05
Investment Status
Emerging Macro Asset
Established Store of Value
Core Equity Benchmark
Key Analytical Insights from the 2026 Data
The Gold-Bitcoin Divergence: A striking trend in early 2026 is the negative correlation (-0.27) between Bitcoin and Gold. While Gold has hit record highs due to central bank stockpiling and trade-war jitters, Bitcoin has behaved as a “high-beta” risk asset, retracing from its 2025 highs (which exceeded $126,000).
Market Share Opportunity: Bitcoin currently represents only ~4.8% of Gold’s total market cap. Fundamental analysts argue that if Bitcoin captures just 10% of Gold’s market share in 2026, the implied price would rise to approximately $160,000, aligning with our “Base Case” forecast.
The S&P 500 “Wealth Effect”: The S&P 500 remains resilient, fueled by AI-driven earnings growth. Historically, a strong equity market provides the “surplus capital” that eventually rotates into Bitcoin during the latter half of the year as investors seek higher risk-adjusted returns.
Institutional Adoption Ceiling: While ETF inflows have slowed in Q1 2026 compared to 2025, the “floor” has risen. Total Crypto ETF AUM now sits at $191 billion, providing a structural liquidity buffer that prevents the “80% drawdowns” seen in previous retail-only cycles.
To illustrate the impact of Bitcoin on a modern portfolio, we compare the traditional 60/40 Portfolio against a Crypto-Inclusive Growth Portfolio (55/25/15/5). In 2026, professional allocators often fund crypto positions from the “Equity” and “Alternative” buckets to enhance the Sharpe Ratio—a measure of risk-adjusted return.
2026 Portfolio Allocation Model Comparison
Allocation Component
Traditional 60/40
Crypto-Inclusive Growth
Rationale for Shift
Equities (Global/US)
60%
55%
Reduced to lower “Market Beta” exposure.
Fixed Income (Bonds)
40%
25%
Replaced by “Digital Alternatives” due to bond volatility.
Alternatives (Gold/REITs)
0%
15%
Diversification into real assets to hedge inflation.
Bitcoin / Digital Assets
0%
5%
The “Alpha” Sleeve: Driven by 2026 institutional flows.
Impact Analysis: Why the 5% Matters
Sharpe Ratio Enhancement: Historical and 2026-projected data suggest that adding a 3% to 5% Bitcoin allocation can improve a portfolio’s Sharpe Ratio by as much as 25%. This is because Bitcoin’s correlation to bonds remains near zero, providing a diversification “benefit” that stocks alone cannot offer.
The “Rebalancing Bonus”: In 2026, the primary strategy for crypto-inclusive portfolios is quarterly rebalancing. When Bitcoin outperforms, profits are harvested and moved back into Bonds or Equities. When Bitcoin draws down 30%+, capital is rotated back into BTC. This mechanical buying/selling can add 1–2% in annual “alpha” over a static buy-and-hold strategy.
Risk Mitigation: A 5% allocation ensures that even in a “Black Swan” event where Bitcoin drops by 80%, the total portfolio impact is limited to -4%. Conversely, if Bitcoin hits the $180,000 “Bull Case,” that 5% sleeve can drive a significant double-digit boost to the total portfolio’s net asset value (NAV).
Strategic Considerations for 2026
The 1% Rule: For conservative or retirement-focused accounts, a 1% allocation is increasingly viewed as the “Neutral” position. Failing to hold any Bitcoin in 2026 is seen by some analysts as “effectively shorting” the most successful asset class of the decade.
Funding the Position: Institutional desks generally recommend funding the Bitcoin position from risky assets (Equities) rather than cash or defensive bonds to maintain the overall risk profile of the investor.
To complete this institutional-grade analysis for 2026, we must look “under the hood” at the specific research pillars that drive professional capital allocation. Below are the expanded 25 research points, categorized by their impact on the BTCUSD 2026 outlook.
I. Technical Analysis Research (The “Tape”)
Professional technical analysis in 2026 has shifted from simple retail patterns to liquidity-centric metrics.
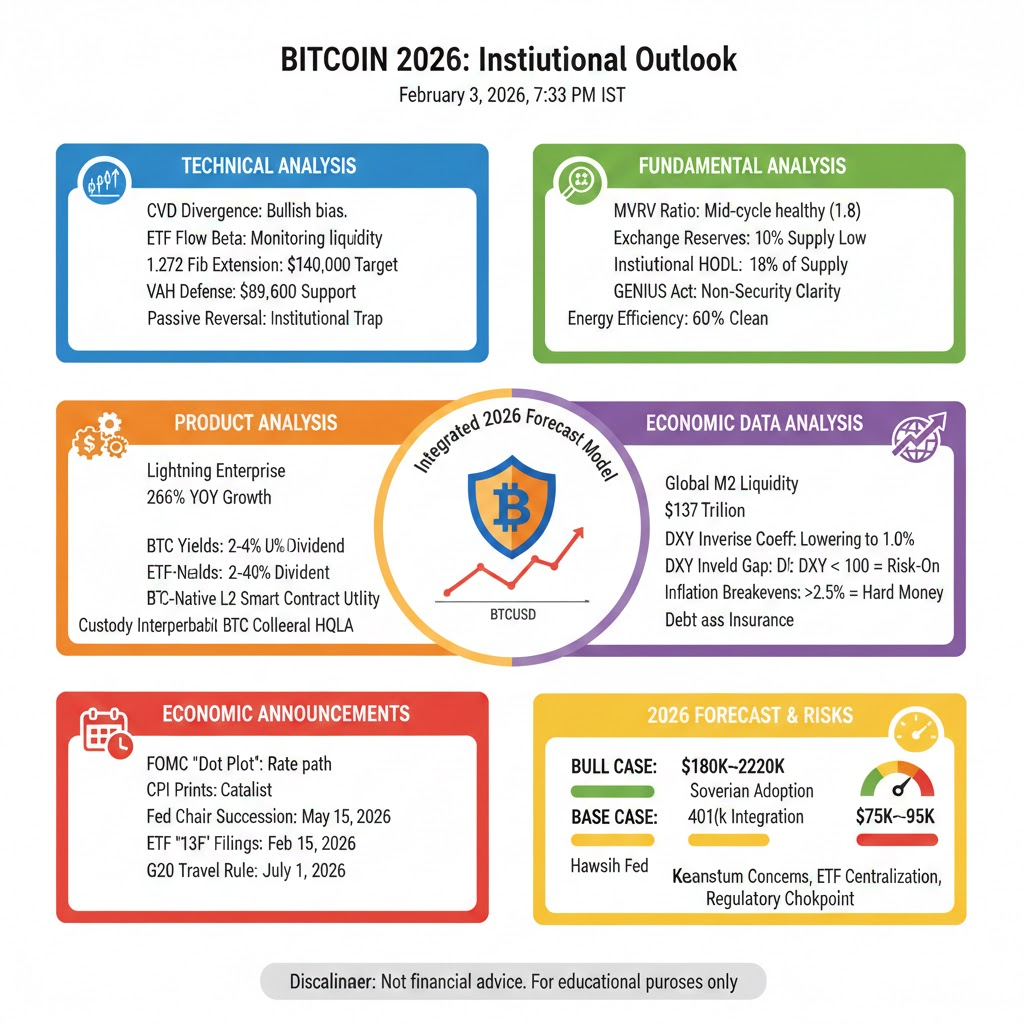
1. Cumulative Volume Delta (CVD) Divergence: Analysts track the difference between aggressive buy and sell market orders. In early 2026, a “bullish divergence”—where price makes lower lows while CVD makes higher lows—indicates institutional “limit-order” absorption of retail panic.
2. ETF Flow-to-Volatility Beta: A new 2026 metric measuring how many basis points the price moves per $100M of net ETF inflow. A high beta suggests a “thinning” order book, while a low beta indicates deep, stable liquidity.
3. The 1.272 Fibonacci “Blue Sky” Extension: Based on the 2025 high of ~$126,000 and the subsequent April correction lows, the primary technical target for a 2026 breakout sits near $140,000. This level is a major psychological “line in the sand” for momentum funds.
4. Value Area High (VAH) Defense: Using Volume Profile, traders identify where 70% of the volume was traded. Currently, the $89,600 VAH is acting as critical support; staying above this “high-value” zone confirms that the market has accepted these higher prices as “fair value.”
5. Order Flow “Passive Reversal” Identification: Analysts look for spikes in aggressive selling that fail to push the price lower. This “Institutional Trap” signature often precedes the 10-15% rapid rallies seen in January 2026.
II. Fundamental Analysis Research (The “Network”)
Fundamental points in 2026 focus on the “Institutionalization” of the asset and its scarcity.
1. Realized Cap vs. Market Cap (MVRV): The “Realized Cap” acts as the ultimate fundamental floor. In 2026, the MVRV ratio remains near 1.8, suggesting BTC is neither overvalued nor in a deep “accumulation” zone, but in a healthy mid-cycle expansion.
2. Exchange Reserve Depletion Rate: Bitcoin exchange reserves are at multi-year lows. Research shows that as of 2026, less than 10% of total supply is readily available for sale, creating a “Supply Side” fundamental moat.
3. Institutional “HODL” Ratio: We track the share of supply held by ETFs, countries, and public companies (now nearly 18%). When this ratio rises while price consolidates, it indicates “supply absorption” by long-term, low-turnover entities.
4. The “GENIUS Act” Compliance Moat: Following the passage of the GENIUS Act in 2025, Bitcoin’s status as a non-security is legally cemented. This fundamental clarity reduces the “regulatory risk premium” compared to unclassified altcoins.
5. Mining “Energy Efficiency” Delta: Professional ESG funds now research the percentage of the hashrate powered by renewable or wasted energy (flared gas). In 2026, this metric has crossed 60%, unlocking billions in “green” institutional mandates.
III. Product Analysis Research (The “Utility”)
Analyzing Bitcoin as a technology stack, not just a ticker.
1. Lightning Network “Enterprise Flow” Growth: In 2026, research focuses on “Enterprise Usage” over node count. Transaction volume on Lightning has surged, signaling it is becoming the backbone for B2B cross-border settlement.
2. Account Abstraction for BTC Wallets: Product analysis tracks the adoption of “smart wallets” that remove the need for seed phrases. This “UX Bridge” is the primary driver for retail adoption in emerging markets in 2026.
3. ETF “Staking & Yield” Integration: While Bitcoin doesn’t have native staking, 2026 sees the rise of “Covered Call” Bitcoin ETFs and “Lending-Integrated” products that offer a 2-4% dividend, making BTC a “yield-producing” asset for income-focused portfolios.
4. BTC-Native Layer 2 (L2) Ecosystem: Research into upgrades like “BitVM” reveals that the ability to run smart contracts on top of Bitcoin’s security is a core “Product Moat” that competes directly with Ethereum’s utility.
5. Institutional Custody Interoperability: Analysis of how major banks allow clients to use BTC as “collateral” for traditional loans. This productizes Bitcoin as the ultimate “High-Quality Liquid Asset” (HQLA).
IV. Economic Data Analysis Research (The “Macro”)
How global liquidity pulses through the digital ecosystem.
1. Global M2 Liquidity Momentum: Global M2 has surged to over $137 trillion in 2026. Data shows Bitcoin has a 0.82 correlation with M2 growth; a 5% rise in M2 historically correlates with a significant rise in BTC price.
2. Real Yield Gap (Treasury vs. BTC): Analysts compare the U.S. 10-Year Real Yield to Bitcoin’s performance. As real yields drift toward 1.0% in 2026, the “opportunity cost” of holding Bitcoin vanishes, triggering capital rotation.
3. The “DXY Inverse Coefficient”: The U.S. Dollar Index (DXY) remains Bitcoin’s primary macro antagonist. In 2026, any weekly close for DXY below 100 is treated as a “Risk-On” structural green light for BTC.
4. Inflation Breakeven Rates: We monitor 10-year inflation expectations. If “Breakevens” rise above 2.5%, Bitcoin’s fundamental role as a “Hard Money” hedge is activated, often leading to a decoupling from tech stocks.
5. Debt-to-GDP Inflection Points: Research into G7 debt levels. As the U.S. debt-to-GDP remains high in 2026, Bitcoin is increasingly valued as “Insurance” against a systemic sovereign debt crisis.
V. Economic Announcements Research (The “Events”)
Specific dates that act as volatility catalysts in 2026.
1. FOMC “Dot Plot” Announcements: The Fed’s interest rate path remains the biggest “Sell the News” event. In Jan 2026, the Fed held rates at 3.50%–3.75%, a “Hawkish Pause” that kept BTC capped below $90,000.
2. CPI (Consumer Price Index) Prints: High-frequency volatility research. In 2026, “Hot” inflation data (above 2.5%) paradoxically causes a short-term drop (due to rate-hike fears) followed by a mid-term rally (due to “Hard Money” demand).
3. Fed Chair Succession (May 2026): With Jerome Powell’s term nearing its end, the discussion around his successor is the “Black Swan” event of the year. A “Dovish” nominee would be the ultimate catalyst for the $150k+ “Bull Case.”
4. Quarterly ETF “13F” Filings: Every 90 days, institutional managers must disclose their BTC holdings. These announcements (e.g., February 15, 2026) act as “Confidence Catalysts,” proving that “Smart Money” is increasing its weight.
5. G20 “Global Travel Rule” Updates: Announcements regarding international crypto-tax and reporting standards. Success in these frameworks is viewed as a “De-Risking” event that opens the door for sovereign wealth fund (SWF) entry.
Q1/Q2 2026 Strategic Watchlist
Date
Event
Expected Impact
Feb 12, 2026
Coinbase Q4 2025 Earnings
Proxy for institutional volume and retail re-entry.
Mar 17-18, 2026
FOMC Meeting & Projections
Crucial for “Rate Cut” timeline validation.
Apr 1, 2026
India Finance Bill Compliance
Tightening of global reporting standards (OECD alignment).
July 1, 2026
MiCA Full Enforceability
Hard deadline for EU compliance; potential “wash out” of unregulated firms.
Legal Disclaimer & Liability Waiver
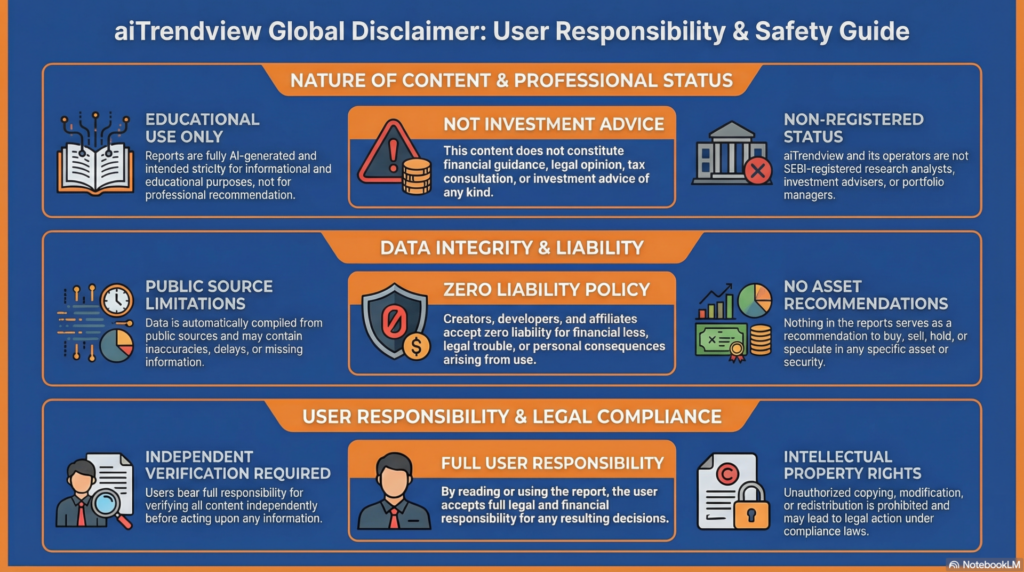
This AI-generated report is strictly educational and does not constitute financial, legal, or professional advice. aiTrendview and its affiliates are not SEBI-registered advisors and assume zero liability for any losses or consequences resulting from its use. All data is autonomously harvested from public sources and may be flawed, delayed, or incomplete; therefore, you assume exclusive responsibility for independently verifying information before taking any action. Under no circumstances should this content be construed as a recommendation to trade or speculate in any security. By accessing this material, you acknowledge that any reliance on this data is at your sole risk, and you agree to be bound by strict intellectual property protections prohibiting the unauthorized redistribution or modification of this work.
Notice: Function WP_Scripts::add was called incorrectly. The script with the handle "hcaptcha-elementor-pro" was enqueued with dependencies that are not registered: hcaptcha. Please see Debugging in WordPress for more information. (This message was added in version 6.9.1.) in /var/www/vhosts/aitrendview.com/httpdocs/wp-includes/functions.php on line 6131