


Global financial markets are transitioning into a complex late-cycle environment characterized by uneven risk appetite, declining crypto liquidity, selective institutional flows, and event-driven volatility across asset classes. Equity markets remain supported by domestic liquidity and sectoral rotation, while derivatives positioning suggests participants are increasingly hedging upside exposure rather than aggressively building directional bets. Commodities continue to benefit from geopolitical and supply narratives, reinforcing inflation-sensitive asset strength. Meanwhile, volatility metrics show stabilization in equities but remain elevated in digital assets due to leverage unwinds and declining volume.
Cryptocurrency markets present a distinctly different picture, with falling trading volumes, mixed capital flows, negative funding rates across multiple sectors, and significant liquidation clusters. Large-cap digital assets such as Bitcoin and Ethereum exhibit resilience but lack sustained momentum, while altcoins face broad-based weakness. Institutional derivatives data reveals declining open interest on major exchanges alongside pockets of speculative positioning in smaller venues. Macro headlines—including policy developments, tariff decisions, and corporate outlook changes—continue to influence cross-asset risk perception, producing a fragmented global market landscape.
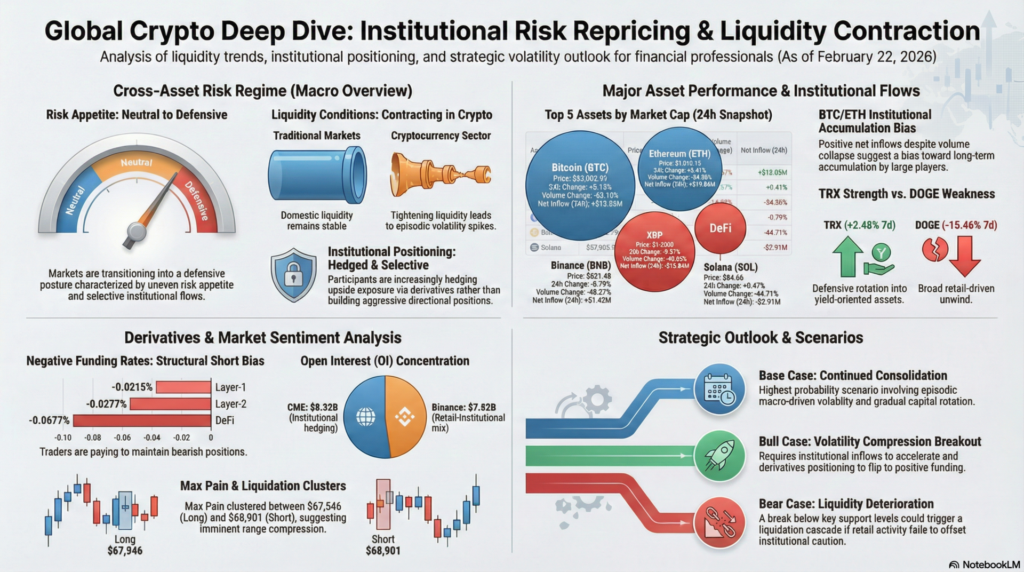
Cross-Asset Risk Regime
Risk Appetite: Neutral to Defensive
Liquidity Conditions: Contracting in crypto, stable in traditional markets
Volatility Outlook: Episodic spikes likely
Institutional Positioning: Hedged, selective deployment
Key observations:
Retail-driven altcoin activity persists despite broad weakness
Large-cap digital assets remain range-bound despite declining participation
Negative funding rates indicate persistent short bias
Derivatives positioning suggests volatility compression before expansion
Macro headlines remain dominant catalysts
Hedge-Fund Interpretation
Large-cap crypto markets exhibit classic late-cycle consolidation characteristics:
This configuration historically precedes either:
A gradual drift lower if liquidity continues to deteriorate
A volatility breakout after prolonged compression
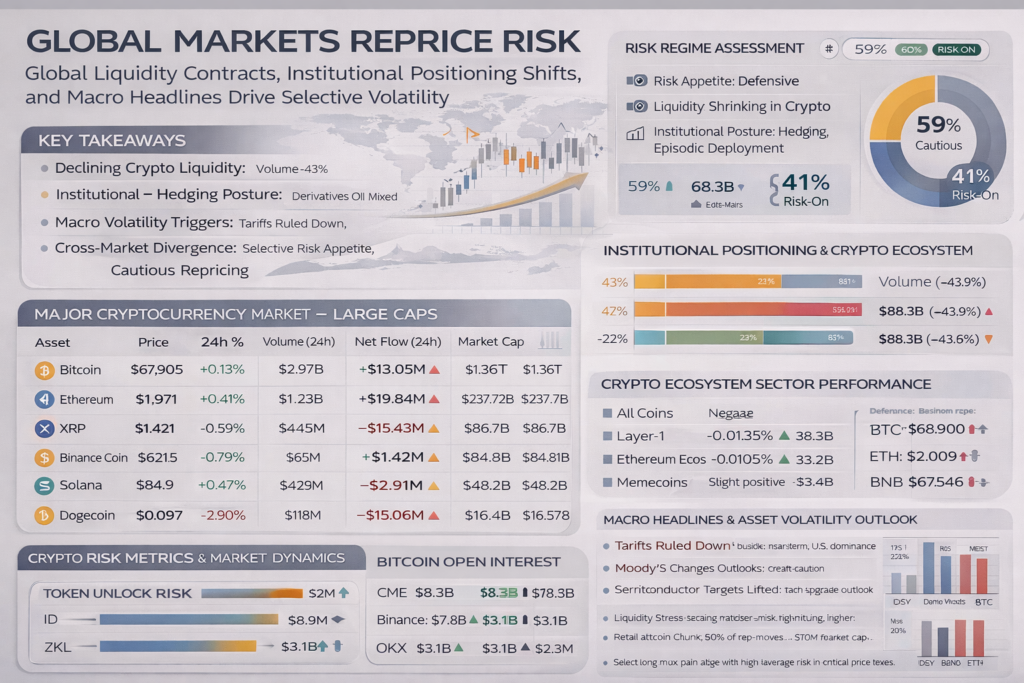
| Asset | Price | 1h % | 24h % | 7d % | Volume (24h) | Volume % | Market Cap | Net Inflow (24h) | Technical Movement | Key Event |
|---|---|---|---|---|---|---|---|---|---|---|
| BTC | $67,905.92 | -0.26% | +0.13% | -2.32% | $2.97B | -63.10% | $1.36T | +$13.05M | Sideways consolidation | Liquidity contraction |
| ETH | $1,970.75 | -0.31% | +0.41% | -4.24% | $1.23B | -54.38% | $237.72B | +$19.84M | Weak rebound | Declining participation |
| XRP | $1.4208 | -0.50% | -0.59% | -6.80% | $445.02M | -48.65% | $86.71B | -$15.43M | Bearish drift | Outflows dominate |
| BNB | $621.48 | -0.68% | -0.79% | -1.52% | $65.10M | -48.27% | $84.81B | +$1.42M | Range bound | Exchange-linked stability |
| SOL | $84.86 | -0.34% | +0.47% | -3.60% | $428.68M | -44.71% | $48.22B | -$2.91M | Volatile sideways | Ecosystem rotation |
| TRX | $0.2887 | -0.31% | +1.37% | +2.48% | $48.54M | -30.36% | $27.34B | +$15.8M | Relative strength | Stable inflows |
| DOGE | $0.09701 | -0.64% | -2.90% | -15.46% | $118.08M | -57.18% | $16.37B | -$15.06M | Downtrend | Retail unwinding |
Major cryptocurrencies are displaying distribution characteristics with declining volume confirming lack of conviction among buyers. Bitcoin and Ethereum remain within broad consolidation zones, while several altcoins have already entered corrective phases. Relative strength in TRX suggests rotation into lower-beta or yield-oriented assets. Momentum indicators implied by price behavior indicate weakening bullish impulses.
Falling transaction activity and trading volume signal reduced speculative demand rather than structural deterioration. Institutional capital flows appear selective, favoring large-cap assets while exiting high-risk tokens. Exchange-related assets such as BNB remain comparatively stable due to ecosystem utility.
Crypto markets continue to respond to macro policy uncertainty, regulatory developments, and liquidity conditions. News of ETF flows, exchange investigations, and technological upgrades influence sentiment but are overshadowed by declining market participation.
Hedge-Fund Interpretation
Negative funding rates across nearly all sectors confirm structural short positioning. Rising open interest alongside falling prices suggests leveraged bearish bets rather than organic selling pressure. Memecoins maintaining activity despite broader weakness indicates persistent retail participation but diminishing market impact.
| Category | 24h Price Change | Funding Rate | Volume (24h) | Volume % | Market Cap | OI | OI (24h) | Liquidation |
|---|---|---|---|---|---|---|---|---|
| All Coins | -2.22% | -0.0135% | $88.30B | -43.91% | $2.16T | $95.45B | +0.38% | $83.87M |
| Layer-1 | -2.04% | -0.0215% | $66.69B | -46.38% | $1.85T | $82.41B | +0.28% | $55.59M |
| Ethereum Ecosystem | -2.51% | -0.0105% | $33.17B | -42.87% | $304.40B | $30.29B | +1.16% | $27.79M |
| DeFi | -2.19% | -0.0008% | $6.42B | -32.56% | $53.44B | $5.54B | -0.32% | $6.23M |
| Memes | -2.17% | +0.0002% | $3.50B | -37.80% | $53.28B | $2.53B | +0.12% | $5.05M |
| Layer-2 | -2.68% | -0.0677% | $2.21B | -29.83% | $6.61B | $702.86M | +3.57% | $4.12M |
Negative funding rates across most categories indicate traders are paying to hold short positions, suggesting bearish bias. Declining volumes confirm weakening momentum. Layer-2 and DeFi segments show mixed signals with rising open interest but falling prices, implying leveraged positioning.
Ecosystem performance reflects capital rotation rather than fundamental deterioration. Large market-cap sectors remain dominant but face reduced speculative inflows. Innovation cycles in DeFi and scaling technologies continue to support long-term outlook despite short-term weakness.
Network upgrades, regulatory developments, and institutional adoption trends remain primary drivers. Liquidity contraction across exchanges has amplified price sensitivity to news events.
| Token | Price | 24h Change | Market Cap | Unlocked | Locked | Next Unlock |
|---|---|---|---|---|---|---|
| MBS | $0.0000626 | — | $39.18K | 90% | 10% | 9.03M MBS |
| AZY | $0.0001606 | — | $77.26K | 83.4% | 16.6% | 11.38M AZY |
| ID | $0.04685 | -4.64% | $20.17M | 64.4% | 35.6% | 12.65M ID |
| SCR | $0.043 | -6.09% | $8.17M | 38.5% | 61.5% | 10.94M SCR |
| ASI | $0.0009772 | +8.06% | $47.12K | 34.9% | 65.1% | 858K ASI |
Token unlocks often generate supply shocks that pressure prices. Assets with lower unlocked supply ratios may experience delayed volatility, while heavily unlocked tokens face reduced scarcity.
Unlock schedules reflect project funding structures and vesting arrangements. Investors closely monitor these events as they influence circulating supply and long-term valuation dynamics.
Large unlocks can coincide with price corrections if market demand is insufficient to absorb new supply.
| Asset | Price | 24h Change | Volume |
|---|---|---|---|
| MEMES | $0.002343 | +98.39% | $5.99M |
| OPN | $0.6318 | +52.55% | $422.31M |
| FIXIN1DAY | $0.0009 | +40.19% | $1.12M |
| SXP | $0.02517 | +25.00% | $31.36M |
| SIREN | $0.26983 | +22.55% | $246.63M |
| Asset | Price | 24h Change | Volume |
|---|---|---|---|
| COLLECT | $0.04747 | -16.49% | $17.95M |
| YGG | $0.04421 | -13.57% | $432.80M |
| CLAWNCH | $0.0000764 | -13.18% | $11.79M |
| UB | $0.03486 | -12.90% | $21.75M |
| ALLO | $0.12 | -12.22% | $176.76M |
Extreme gainers indicate speculative rotation into low-cap tokens, often driven by short squeezes or momentum trading. Large losers typically reflect profit-taking or liquidity withdrawal.
Most movements appear sentiment-driven rather than based on underlying fundamentals.
Retail participation and social media narratives often dominate short-term performance in these assets.
| Exchange | OI (BTC) | OI Value | OI Change (24h) | Technical Signal |
|---|---|---|---|---|
| CME | 122.47K | $8.32B | -0.41% | Institutional hedging |
| Binance | 115.17K | $7.82B | +0.59% | Retail-institutional mix |
| OKX | 46.46K | $3.16B | +1.41% | Rising speculative interest |
| Bybit | 56.58K | $3.84B | -0.80% | Position reduction |
| KuCoin | 7.80K | $529.79M | +5.41% | High volatility exposure |
Mixed changes in open interest indicate absence of a unified directional bias. Rising OI on smaller exchanges suggests speculative leverage rather than institutional positioning.
Institutional participation remains concentrated on CME, while retail flows dominate offshore exchanges.
Macro uncertainty and regulatory developments continue to influence derivatives participation.
| Asset | Price | Short Max Pain | Long Max Pain | Interpretation |
|---|---|---|---|---|
| BTC | $67,881.5 | $68,901.55 | $67,546.42 | Range compression |
| ETH | $1,969.76 | $2,009.17 | $1,964.65 | Downside pressure |
| SOL | $84.74 | $87.41 | $83.60 | Volatile consolidation |
| XRP | $1.4203 | $1.4544 | $1.4165 | Near equilibrium |
| BNB | $621.98 | $638.87 | $618.53 | Slight bearish bias |
Max pain levels indicate price zones where options writers experience minimal loss. Current positioning suggests markets may gravitate toward these levels before major directional moves.
Large derivatives exposure highlights the importance of options markets in price discovery.
Sharp moves could occur if prices break outside max pain zones, triggering cascading liquidations.
Major headlines include corporate outlook revisions, tariff-related policy developments, Supreme Court decisions affecting trade dynamics, and technology sector momentum expectations. Financial sector updates and ETF activity remain focal points for institutional investors.
Markets are not exhibiting panic conditions but rather controlled risk reduction. Large participants appear to be preserving capital while maintaining optionality for future deployment. The coexistence of declining volume, stable prices, and elevated derivatives exposure suggests a coiled market structure vulnerable to sharp directional moves.
For professional portfolio management, the priority shifts from directional conviction to volatility management, liquidity monitoring, and cross-asset correlation analysis. The next sustained trend will likely emerge not from technical breakouts alone but from a decisive change in macro liquidity conditions or policy expectations.
Conclusion — Strategic Takeaways
The current market environment reflects a transition from broad risk-on conditions to selective opportunity-driven positioning. Liquidity contraction in digital assets contrasts with relative stability in traditional markets, underscoring the importance of cross-asset diversification. Institutional flows appear cautious, emphasizing hedging strategies and defensive positioning rather than aggressive expansion of risk exposure.
For training and learning purposes, this environment demonstrates how markets evolve when macro uncertainty intersects with leverage-driven asset classes. Analysts should focus on liquidity indicators, derivatives positioning, and capital flows rather than price movements alone. Understanding these dynamics enables more accurate forecasting of volatility regimes and potential trend reversals across global financial markets.
Legal Disclaimer & Liability Waiver
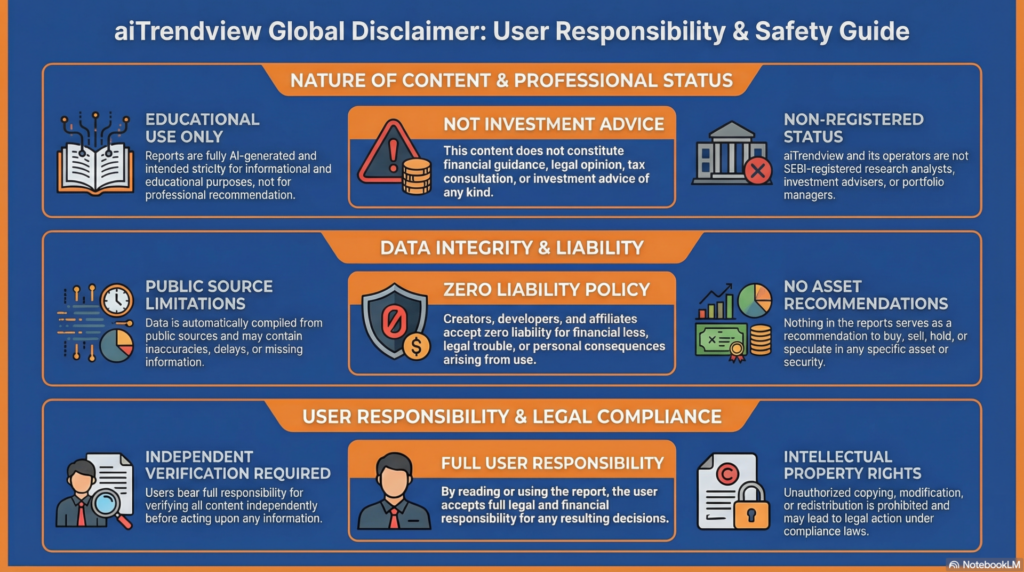
This AI-generated report is strictly educational and does not constitute financial, legal, or professional advice. aiTrendview and its affiliates are not SEBI-registered advisors and assume zero liability for any losses or consequences resulting from its use. All data is autonomously harvested from public sources and may be flawed, delayed, or incomplete; therefore, you assume exclusive responsibility for independently verifying information before taking any action. Under no circumstances should this content be construed as a recommendation to trade or speculate in any security. By accessing this material, you acknowledge that any reliance on this data is at your sole risk, and you agree to be bound by strict intellectual property protections prohibiting the unauthorized redistribution or modification of this work.