


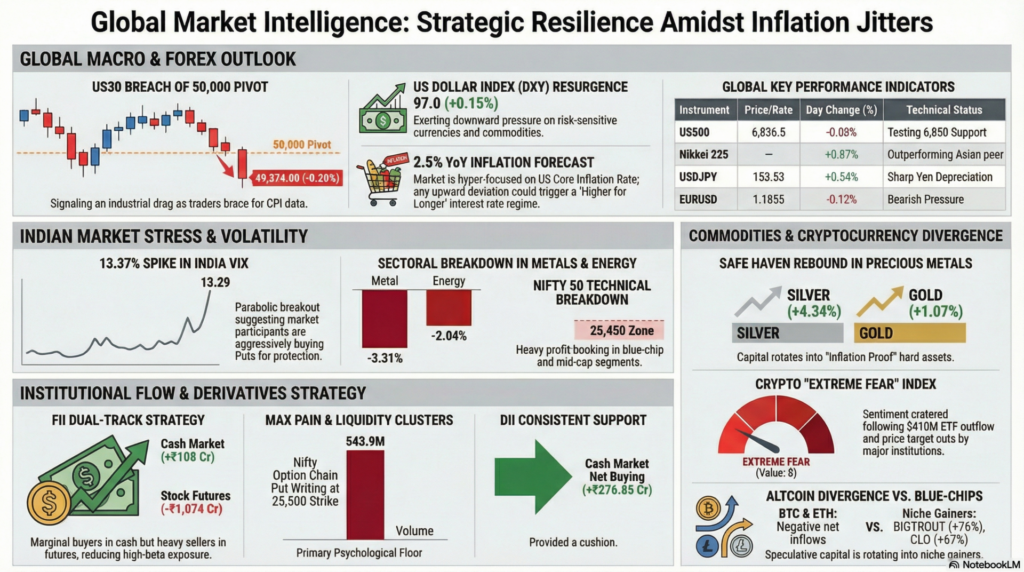
The global financial landscape on February 13, 2026, is characterized by a state of “Watchful Resilience” as major equity indices navigate a deluge of macroeconomic data. In the Western markets, US futures exhibited a slight defensive posture with the US30 and US500 edging lower by 0.20% and 0.08% respectively, as traders braced for critical Core Inflation readings. European markets mirrored this caution, with the French CAC 40 leading declines at -0.29%, while Asian markets provided a rare bright spot as the Nikkei 225 surged 0.87%. This collective consolidation suggests that global investors are currently prioritizing capital preservation over aggressive growth until the trajectory of US consumer prices is fully digested.
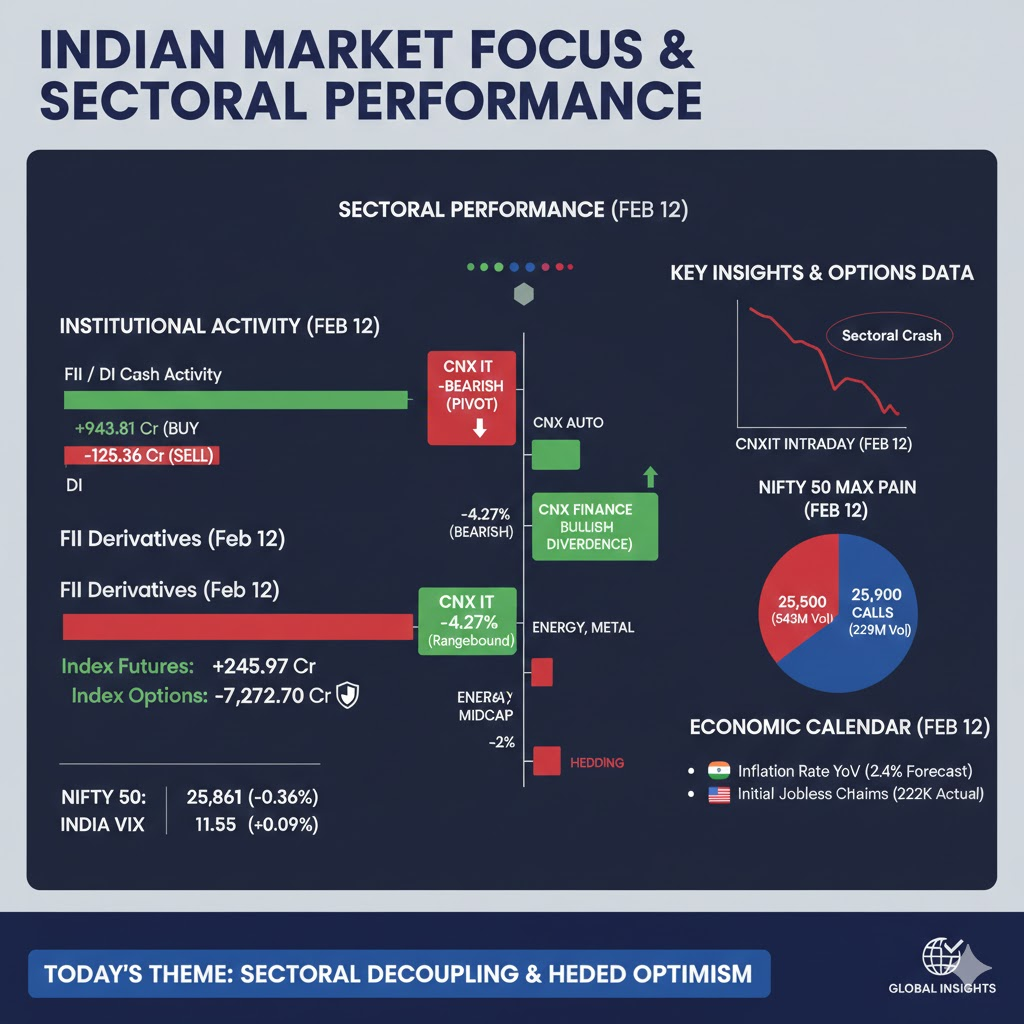
In the Indian domestic market, the narrative remains one of localized structural strength despite a marginal rise in the fear gauge, with the India VIX surging 13.37% to reach 13.29. The Nifty 50 and Sensex both recorded declines exceeding 1.2%, as heavy profit-booking in heavyweight sectors like Energy and FMCG dragged the benchmarks lower. While Foreign Institutional Investors (FIIs) maintained a modest net buying streak in the cash market at +₹108.42 Crores, their defensive stance in the derivatives segment—evidenced by net selling in Index Futures and Options—indicates a shift toward a “Hedged-Long” strategy. Sectoral bifurcation was stark, with PSU Banks showing minor resilience while broader market sentiment remained dampened by global cues.
| Instrument | Price / Rate | Day Change (%) | Technical Movement | Key Event / Driver |
| US500 | 6,836.5 | -0.08% | Testing 6,850 Support | Pre-CPI Positioning |
| US30 | 49,374.00 | -0.20% | Breach of 50k Pivot | Industrial Drag |
| NAS100 | 24,711.9 | -0.11% | Rangebound Churn | Tech Growth Pivot |
| DXY | 97.062 | +0.15% | Bullish Recovery | Dollar Index Resurgence |
| VIX (Global) | 20.61 | -1.01% | Floor Support Bounce | Tactical Hedging |
| EURUSD | 1.1855 | -0.12% | Bearish Pressure | Euro Softness |
| USDJPY | 153.53 | +0.54% | Sharp Bullish Pivot | Yen Depreciation |
| USDINR | 90.6120 | +0.10% | Rupee Softness | DXY Impact |
Technical Analysis: Global futures are exhibiting a “Bearish-Neutral” bias, with the US30 notably slipping back below the 50,000 psychological mark. The Dollar Index (DXY) has reclaimed the 97.0 level, which is currently acting as a primary resistance-turned-support, exerting downward pressure on risk-sensitive currencies.
Fundamental Analysis: The fundamental backdrop is dominated by the resurgence of the US Dollar as investors seek safety ahead of inflationary data. The sharp 0.54% rise in USDJPY suggests an unwinding of carry trades and a recalibration of interest rate differentials as the “Warsh Fed” transition enters a critical phase.
Economic Announcements: The economic calendar is top-heavy with the US Core Inflation Rate (MoM & YoY). Forecasts suggest a steady 2.5% YoY, but any deviation toward the higher side could ignite fears of a “Higher for Longer” rate regime.
| Index / Sector | Last Price | Day Change (%) | Technical Movement | Event / Driver |
| NIFTY 50 | 25,471.10 | -1.30% | Gap Down Breakout | Global Jitters |
| SENSEX | 82,626.76 | -1.25% | Testing Base Levels | Blue-chip Selloff |
| BANKNIFTY | 60,186.65 | -0.91% | Breaching 60.5k Pivot | Financial Fatigue |
| INDIA VIX | 13.29 | +13.37% | Parabolic Breakout | Volatility Spike |
| CNX ENERGY | 35,709.90 | -2.04% | Sharp Bearish Pivot | Commodity Weakness |
| CNX AUTO | 28,234.30 | -0.95% | Retesting 28k | Sectoral Churn |
| CNX METAL | 11,872.80 | -3.31% | Technical Breakdown | Industrial Slowdown |
| MIDCPNIFTY | 13,616.00 | -2.02% | Deep Profit Booking | Small-cap De-leveraging |
Technical Analysis: The Nifty 50 has witnessed a significant technical breakdown, gapping down to test the 25,450 zone. The most alarming signal is the 13.37% spike in India VIX, which suggests that market participants are aggressively buying protection (Puts) against further downside.
Fundamental Analysis: Domestic sentiment is currently under pressure from both global risk-off cues and local liquidity concerns. While PSU Banking (SBIN +0.52%) showed contrarian strength, the broader indices were dragged down by a sharp 3.31% decline in the Metal sector and 2.04% in Energy, reflecting a cooling of industrial demand.
Economic Announcements: Domestic data focus remains on Bank Loan Growth (Prev: 13.1%) and Deposit Growth (Prev: 10.6%), with investors looking for signs of credit expansion to offset global equity headwinds.
| Segment | Net Buy/Sell (Cr) | Action Bias |
| FII Cash Market | +108.42 | Marginal Buying |
| DII Cash Market | +276.85 | Consistent Support |
| FII Index Futures | -136.93 | Directional Short |
| FII Index Options | -687.02 | Protective Selling |
| FII Stock Futures | -1,074.45 | Tactical De-leveraging |
| Index | ATM Strike | Put Volume (Max) | Call Volume (Max) | Market Sentiment |
| NIFTY | 25,500 | 543,912,850 | 229,345,220 | Put Writing Heavy |
| BANKNIFTY | 60,000 | 6,240,390 | 1,821,000 | Support Base |
Technical Analysis: The Nifty option chain shows massive Put writing at the 25,500 strike (543.9M volume), indicating that retail and HNI traders are betting on this level as a hard floor. Similarly, BankNifty finds its primary psychological anchor at the 60,000 strike.
Fundamental Analysis: Institutional behavior exhibits a “Dual-Track” strategy. While FIIs remain marginal buyers in cash (+₹108 Cr), their heavy selling in Stock Futures (-₹1,074 Cr) suggests they are reducing exposure in individual high-beta names while supporting the broader index narrative through cash.
Economic Announcements: Foreign Exchange Reserves at $723.77 Billion provide the necessary fundamental cushion for the RBI to intervene if the Rupee’s 90.61 level faces aggressive speculative pressure from a rising Dollar.
| Instrument | Price | Day Change (%) | Technical Status | Headline Sentiment |
| Bitcoin (BTC) | $66,829.80 | +0.94% | Resilience at $66k | Bullish Pivot |
| GOLD (XAUUSD) | $4,974.50 | +1.07% | Safe Haven Rebound | Inflation Hedge |
| SILVER | $78.487 | +4.34% | Momentum Breakout | Industrial Surge |
| BRENT CRUDE | $67.285 | +0.25% | Sideways Consolidation | Iranian Risks Easing |
| NATGAS | $3.797 | -2.99% | Bearish Breakdown | Oversupply Concerns |
Technical Analysis: Commodities are leading the charge today, with Silver posting an impressive 4.34% surge to reclaim the $78.50 level. Gold has staged a strong rebound of 1.07%, reclaiming its status as the primary inflation hedge as investors await US CPI data.
Fundamental Analysis: The uptick in Gold and Silver is driven by “Bargain Hunting” at one-week lows. Conversely, Crude Oil remains on track for a weekly loss as supply outlooks improve and geopolitical risks in Iran appear to be receding.
Economic Announcements: The Baker Hughes Total Rigs Count (Prev: 551) will be closely monitored tonight; an increase in US drilling activity would further dampen the upside potential for Brent and WTI crude.
Based on the comprehensive data provided from your dashboard captures, here is a detailed case study of the current cryptocurrency market landscape.
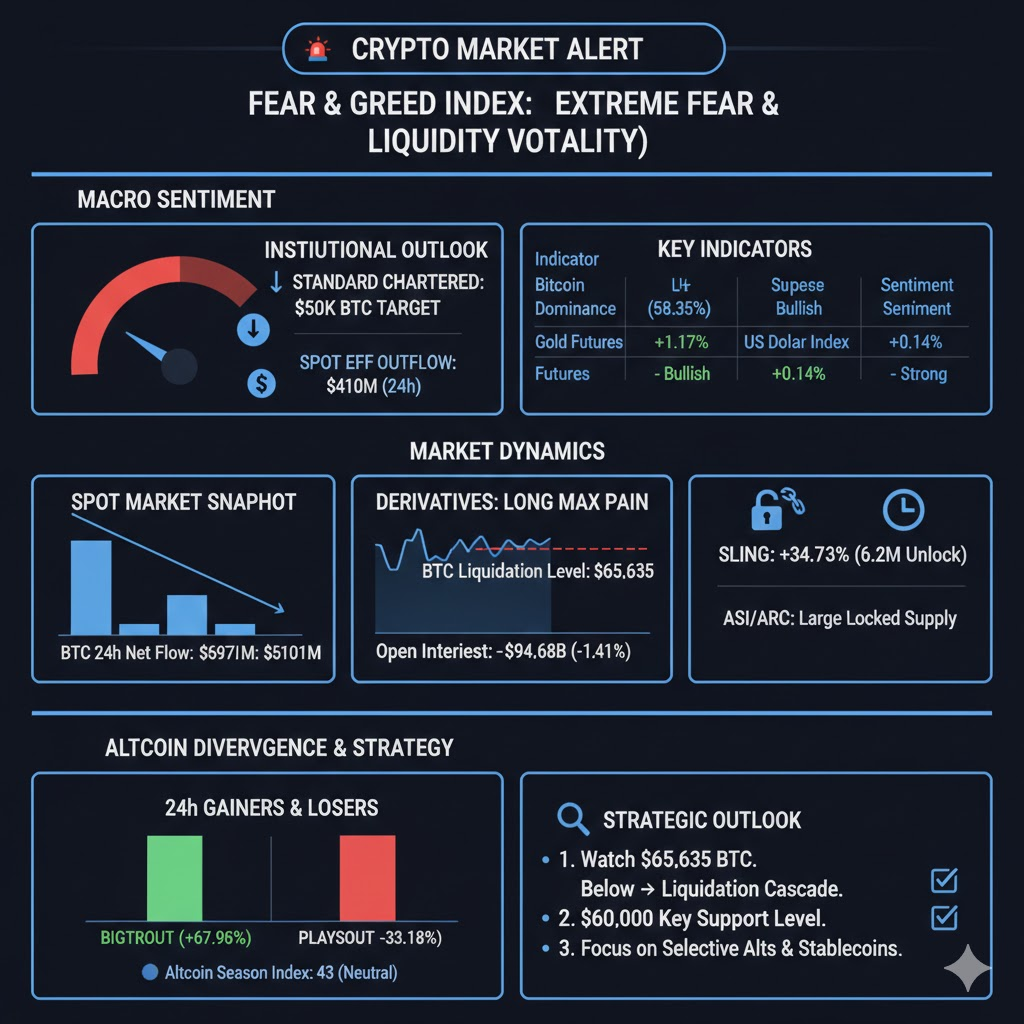
The market is currently experiencing a period of significant “Extreme Fear” (Index: 8), driven by downward price revisions from major institutions and consistent outflows from spot ETFs. While Bitcoin struggles to maintain the $66,000 level, the broader market is seeing a massive rotation into niche altcoins and meme tokens, even as liquidations loom over major positions.
The prevailing sentiment is heavily bearish. Leading the news cycle is Standard Chartered, which slashed its Bitcoin price target, predicting a potential dive to $50,000. This institutional caution is mirrored in the ETF markets, which saw a massive $410M “bleed” as BTC slipped below $66,000. This suggests that the “smart money” is currently derisking in anticipation of further volatility.
| Indicator | Value | Sentiment |
| Fear & Greed Index | 8 | Extreme Fear |
| Bitcoin Dominance | 58.35% | High (Consolidating) |
| Gold Futures | +1.17% | Bullish (Safe Haven Play) |
| U.S. Dollar Index (DXY) | +0.14% | Strong (Pressure on Crypto) |
Despite the bearish news, the 24-hour spot data shows that while prices are down, the “dip-buying” activity is concentrated in specific assets. Bitcoin (BTC) and Ethereum (ETH) have seen significant negative net inflows over 24 hours, indicating selling pressure, while smaller assets like LEO and BCH are showing relative strength.
Top Assets by Market Cap (24h Snapshot)
| BTC | $66,856 | -1.28% | -$197.24M |
| ETH | $1,956.8 | -1.47% | -$101.44M |
| XRP | $1.368 | -2.10% | -$35.70M |
| BCH | $524 | +2.38% | +$2.12M |
The derivatives market is currently a “minefield” for over-leveraged traders. Open Interest has declined by 1.41% ($94.68B total), suggesting that traders are closing positions or being liquidated. The “Liquidation Max Pain” data shows that the market is hovering dangerously close to levels that would force mass liquidations for “Long” positions.
Liquidation Risk Thresholds (24h)
| BTC | $66,834.8 | $65,635.78 | -1.79% |
| ETH | $1,956.07 | $1,892.51 | -3.25% |
| SOL | $79.96 | $77.51 | -3.06% |
A significant factor contributing to the “Extreme Fear” is the schedule of upcoming token unlocks. Large quantities of supply are hitting the market today (2026-02-13), which typically creates sell-side pressure. ASI and ARC are notable for having high percentages of their supply still “Locked,” meaning future dilution remains a constant threat to price stability.
| Symbol | Price | 24h Change | Next Unlock Amount |
| SLING | $0.00011 | +34.73% | 6.20M SLING |
| ASI | $0.00098 | +9.01% | 858.20K ASI |
| ARC | $0.0878 | +15.60% | 600.21K ARC |
While the majors (BTC, ETH) bleed, there is a frantic search for yield in low-cap “gainers.” Tokens like BIGTROUT and CLO have seen massive 24-hour pumps exceeding 60%. This “Altcoin Season Index” at 43 suggests we are in a neutral zone—not a full alt-season, but a market where capital is highly selective and rotating into speculative plays to offset losses in blue-chip holdings.
24h Top Gainers vs. Losers
| BIGTROUT | +76.83% | PLAYSOUT | -33.14% |
| CLO | +67.96% | PLAY | -30.89% |
| AKE | +36.11% | SUP | -29.03% |
The market is at a critical juncture. With the Fear & Greed Index at 8, the market is technically “oversold,” which often precedes a relief rally. However, the institutional narrative (Standard Chartered’s $50k target) and the $410M ETF outflow suggest that the bottom may not be in. Traders should keep a close eye on the $65,635 BTC Long Max Pain level; a breach below that could trigger a cascade of liquidations, sending the market toward the $60,000 psychological support.
Would you like me to analyze the specific “Short Max Pain” levels to identify potential short-squeeze targets for these assets?
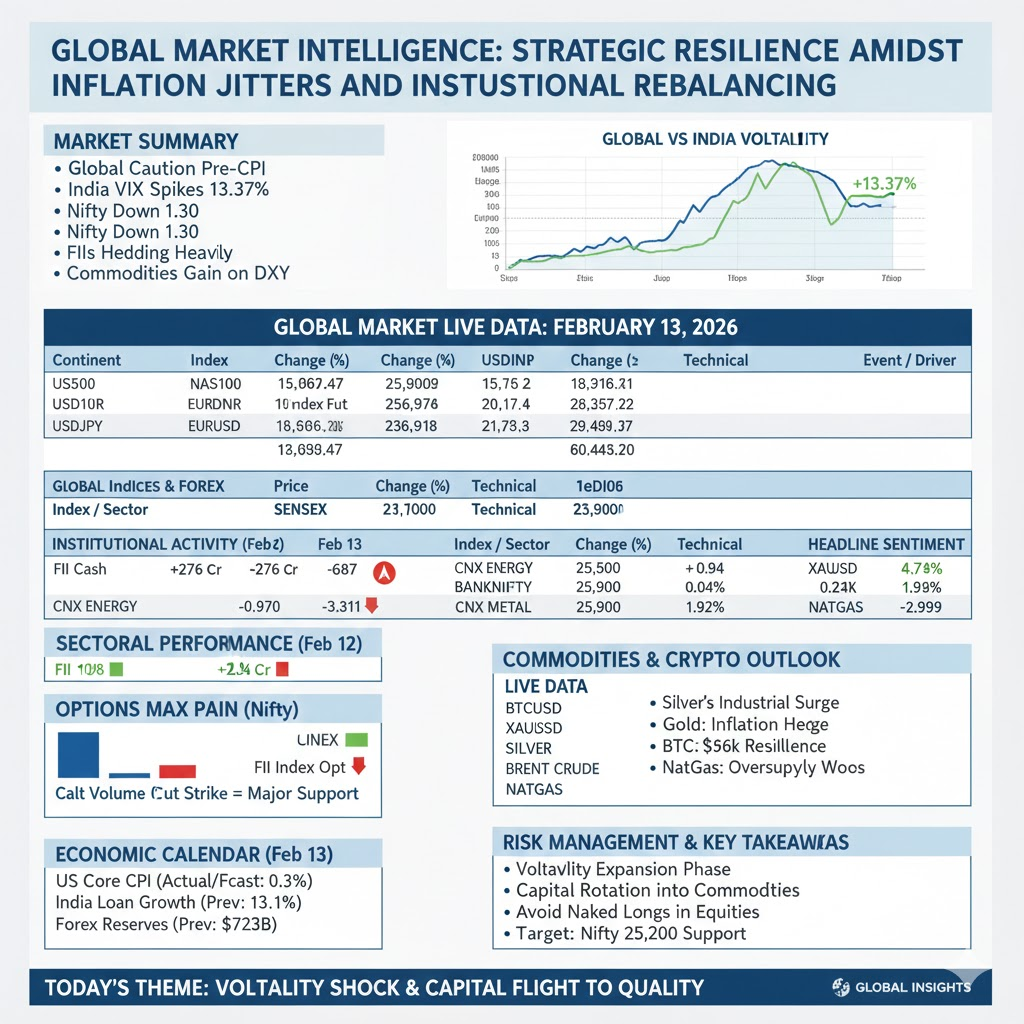
For educational and training purposes, today’s session serves as a masterclass in Volatility Expansion (Vega) Management. The 13.37% spike in India VIX alongside a gapping-down Nifty teaches us that volatility is not just a measure of fear, but a functional cost of protection. When the VIX spikes, option premiums swell, making “Hedging” expensive. A trainee should observe how the markets gapped down to test the “Max Pain” levels on the option chain, specifically the 25,500 Put strike where the highest liquidity is clustered. This teaches that during “Risk-Off” phases, price often gravitates toward areas of maximum liquidity to flush out weak-handed retail writers.
Secondly, the divergence between Commodities and Equities provides a key lesson in “Capital Rotation.” While global equities fell, Gold and Silver rose sharply (+1.07% and +4.34% respectively). This indicates that capital is moving into “Inflation Proof” hard assets as a hedge against the US Core CPI data. For a professional trader, the takeaway is clear: when the Dollar Index (DXY) and Bond Yields rise simultaneously (as US10Y did by 0.61%), it creates a “Liquidity Squeeze” in equities, making hard commodities the only viable safe harbor. Mastering this inter-market correlation is essential for navigating the complex global macro environment of 2026.
Legal Disclaimer & Liability Waiver
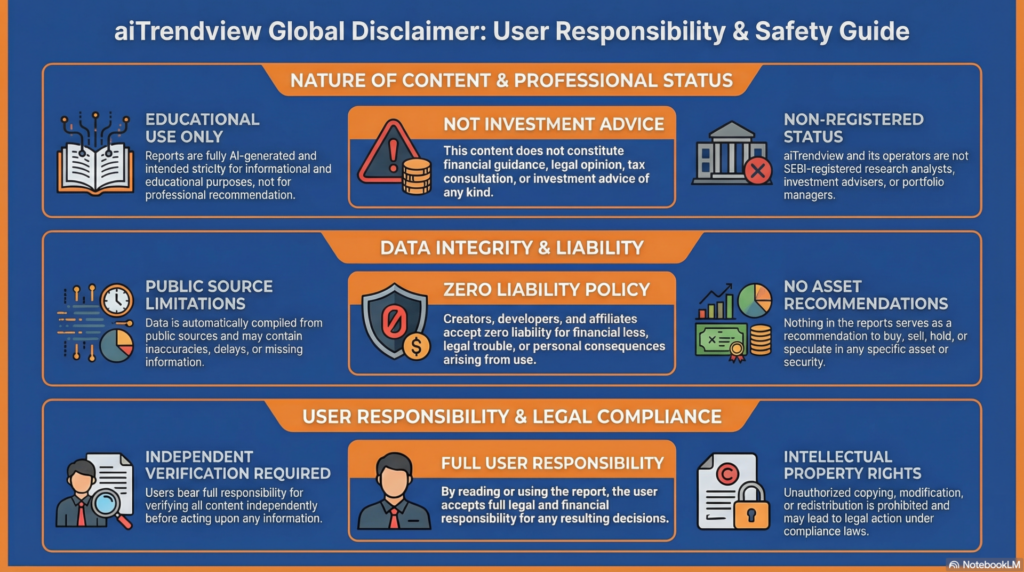
This AI-generated report is strictly educational and does not constitute financial, legal, or professional advice. aiTrendview and its affiliates are not SEBI-registered advisors and assume zero liability for any losses or consequences resulting from its use. All data is autonomously harvested from public sources and may be flawed, delayed, or incomplete; therefore, you assume exclusive responsibility for independently verifying information before taking any action. Under no circumstances should this content be construed as a recommendation to trade or speculate in any security. By accessing this material, you acknowledge that any reliance on this data is at your sole risk, and you agree to be bound by strict intellectual property protections prohibiting the unauthorized redistribution or modification of this work.