


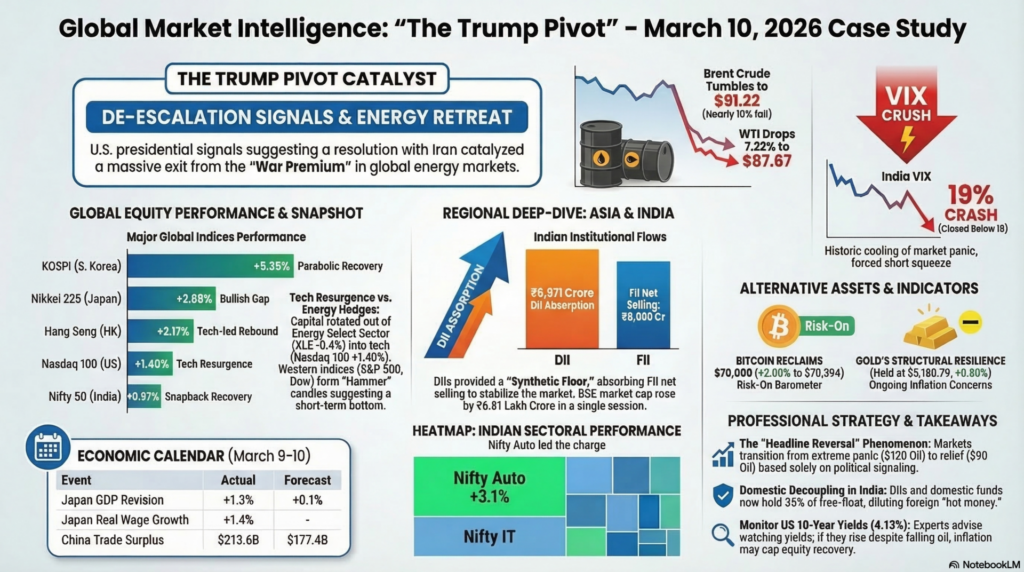
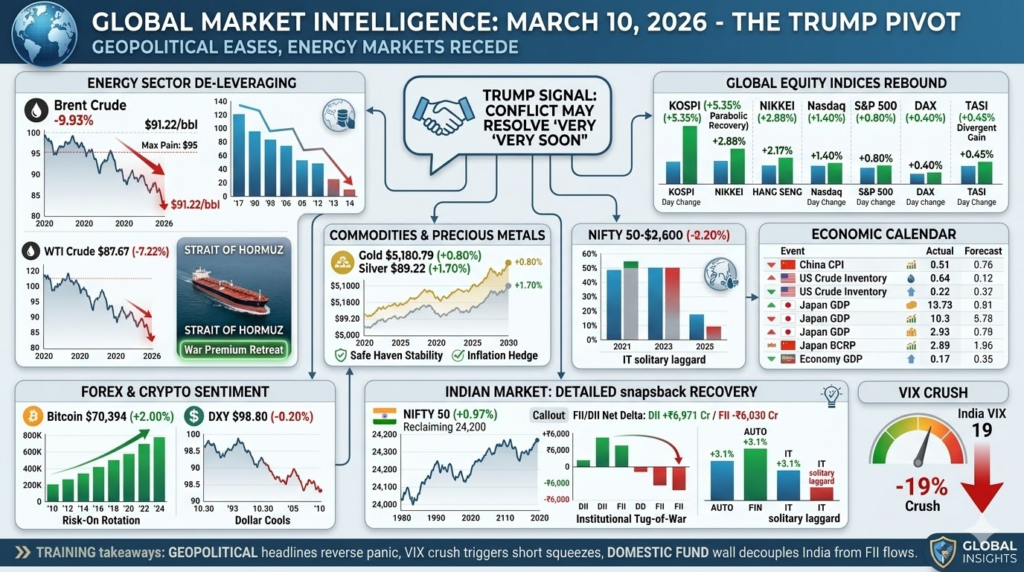
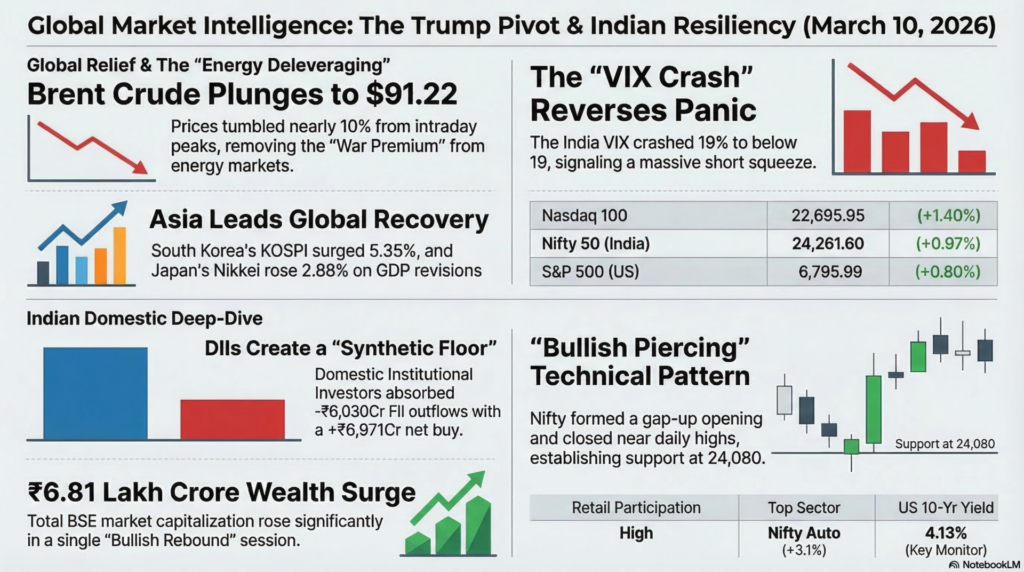
The trading session of Tuesday, March 10, 2026, has been defined by a dramatic shift in global risk appetite, triggered by U.S. President Donald Trump’s signals that the conflict with Iran may resolve “very soon.” This “Trump Pivot” has catalyzed a massive deleveraging of the “War Premium” in energy, with Brent crude tumbling nearly 10% from its intraday peaks to trade near $91.22 per barrel. This retreat in oil prices has provided a massive relief rally for energy-dependent Asian and Emerging markets, specifically South Korea’s KOSPI, which surged over 5% in a single session, necessitating temporary trading halts. While the optimism is palpable, it remains fragile, as the market balances these verbal assurances against ongoing reports of tanker incidents near Abu Dhabi.
In the Indian domestic market, the session was a classic “Bullish Rebound,” as the Nifty 50 snapped a two-day losing streak to reclaim the 24,200 level. The narrative was dominated by a sharp cooling of the India VIX, which crashed 19% to close below 19, signaling that the extreme panic of the previous 48 hours is being absorbed. Institutional dynamics highlight a structural cushion; while Foreign Institutional Investors (FIIs) remained in a net-selling posture during the previous session, the Domestic Institutional Investors (DIIs) provided a heroic net absorption of +₹6,971 Crores, effectively creating a “Synthetic Floor” that allowed the market to rebound as geopolitical tensions thawed.
| Index | Price / Close | Day Change (%) | Technical Status | Future Support / Resistance |
| S&P 500 (US) | 6,795.99 | +0.80% | Recovery Pivot | Support: 6,750 / Resistance: 6,850 |
| Nasdaq 100 | 22,695.95 | +1.40% | Tech Resurgence | Support: 22,400 / Resistance: 23,000 |
| Dow Jones | 47,740.80 | +0.50% | Bullish Hammer | Support: 47,200 / Resistance: 48,000 |
| Nifty 50 (India) | 24,261.60 | +0.97% | Snapback Recovery | Support: 24,080 / Resistance: 24,450 |
| Bank Nifty | 56,950.80 | +1.60% | Bullish Breakout | Support: 56,000 / Resistance: 57,500 |
Technical Analysis: Western indices have formed “Hammer” candles on daily charts, suggesting a short-term bottom. The S&P 500 reclaimed its psychological floor at 6,790, while the Nasdaq jumped 1.4% as AI infrastructure construction continues to provide a fundamental tailwind despite geopolitical noise.
Fundamental Analysis: The primary driver is the “Risk-On” rotation as the Energy Select Sector (XLE) lost 0.4%, indicating capital moving out of inflation hedges and back into growth-oriented tech and industrials.
| Index | Price / Close | Day Change (%) | Technical Movement | Headline Sentiment |
| Nikkei 225 | 54,248.39 | +2.88% | Bullish Gap | GDP Revision & Wage Growth |
| KOSPI | 5,532.59 | +5.35% | Parabolic Recovery | Policy-driven Volatility |
| Hang Seng | 25,959.90 | +2.17% | Tech-led Rebound | China Trade Surplus Boost |
| ADX (UAE) | 9,807.48 | -0.56% | Minor Correction | Regional Tension Proximity |
| DAX (Germany) | 20,450.00 | +0.40% | Recovery Attempt | Energy Cost Relief Hope |
Research Report: Asia led the global recovery; Japan’s Nikkei surged 2.88% following a massive GDP revision (from 0.1% to 1.3%) and the first real wage increase in 13 months (+1.4%). Arab markets remained slightly muted compared to Asia, with the ADX slipping 0.56% as local investors remained sensitized to physical tanker disruptions in the Strait of Hormuz.
| Instrument | Price / Close | Day Change (%) | Technical Support | Headline Driver |
| DXY (USD) | 98.80 | -0.20% | 98.40 | Yield Softness |
| USDJPY | 157.97 | +0.15% | 156.50 | BoJ Rate Expectations |
| Bitcoin (BTC) | $70,394 | +2.00% | $68,600 | Psychological Breakthrough |
| Ethereum (ETH) | $2,052 | +1.30% | $2,000 | Alt-coin Strength |
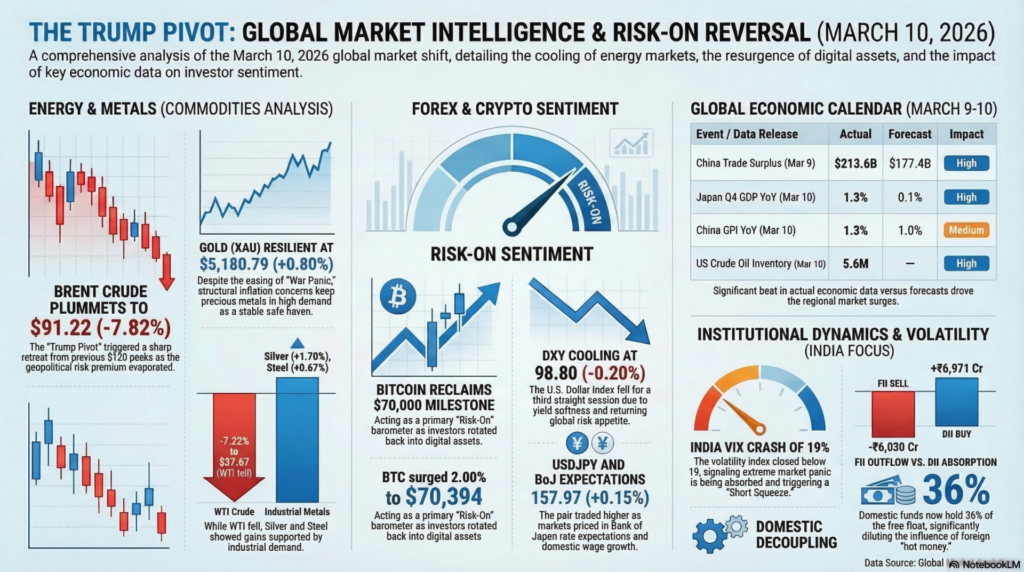
Analysis: The Dollar Index (DXY) is cooling as risk appetite returns, falling for a third straight session to 98.80. In the crypto space, Bitcoin has decisively reclaimed the $70,000 level, acting as a “Risk-On” barometer as investors rotate back into digital assets amid easing macro uncertainty.
| Instrument | Price | Day Change (%) | Support / Resistance | Movement / Trend |
| Brent Crude | $91.22 | -7.82% | $89 / $95 | Sharp Retreat |
| WTI Crude | $87.67 | -7.22% | $81 / $91 | Corrective Churn |
| Gold (XAU) | $5,180.79 | +0.80% | $5,150 / $5,200 | Safe Haven Stability |
| Silver (XAG) | $89.22 | +1.70% | $88 / $93 | Industrial Demand |
| Steel (Fe) | 3,120 CNY | +0.67% | 3,050 / 3,250 | Supply Stability |
Analysis: Crude oil is the day’s primary laggard, with WTI falling below $90 after hitting $120 previously. Gold has remained surprisingly resilient at $5,180, suggesting that while the “War Panic” has eased, structural inflation concerns keep precious metals in high demand.
| Time | Event / Data Release | Actual | Forecast | Impact |
| Mar 9 | China Trade Surplus | $213.6B | $177.4B | High |
| Mar 10 | Japan Q4 GDP (YoY) | 1.3% | 0.1% | High |
| Mar 10 | China CPI (YoY) | 1.3% | 1.0% | Medium |
| Mar 10 | US Crude Oil Inventory | 5.6M | — | High |
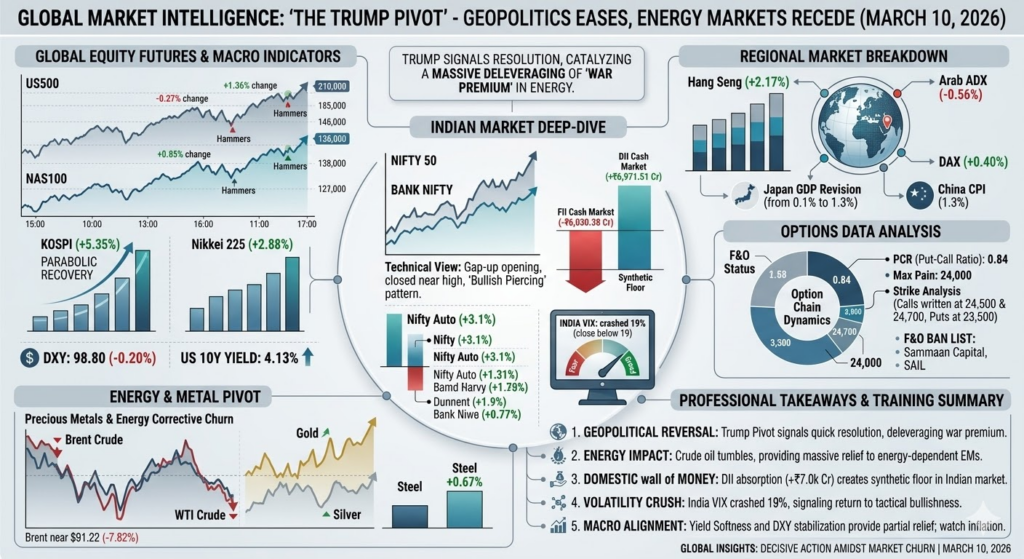
For educational purposes, the March 10 session illustrates the “Headline Reversal” phenomenon. Markets can move from extreme panic (Oil at $120) to relief (Oil at $90) based on political signaling alone. For a trainee trader, the key lesson is the VIX Crush; when the India VIX falls 19% in a single day, it creates a massive “Short Squeeze” in the option chain as sellers of calls are forced to cover their positions.
Secondly, the “Domestic Decoupling” in India is no longer a myth. With DIIs and domestic funds now holding 36% of the free-float, the influence of “hot money” (FIIs) is significantly diluted. The strategy for tomorrow is to monitor the US 10-Year yield (4.13%); if yields continue to creep up despite lower oil, it signals that inflation expectations are becoming “sticky,” which could cap the equity recovery.
Legal Disclaimer & Liability Waiver – aiTrendview.com
All content, reports, signals, analytics, forecasts, and materials published on aiTrendview.com are fully AI-generated outputs produced through automated systems with zero human research, manual validation, editorial review, or professional intervention. This platform does not provide financial, investment, trading, legal, tax, or professional advice of any kind. aiTrendview.com, its owners, affiliates, and associated entities are not registered with SEBI or any other regulatory authority as investment advisors, research analysts, brokers, or financial consultants. All data is autonomously aggregated from publicly available sources and algorithmic processes that may contain inaccuracies, delays, omissions, or technical errors. Users are solely and exclusively responsible for independently verifying all information before making any financial, legal, or commercial decisions.
By accessing or using this platform, you expressly acknowledge and agree that any reliance on the information provided is entirely at your own risk. aiTrendview.com assumes absolutely no liability for any direct, indirect, incidental, consequential, financial, legal, trading, or other losses arising from the use of, reliance upon, or inability to use any content or data published. Nothing on this platform shall be construed as a solicitation, endorsement, or recommendation to buy, sell, hold, or speculate in any security, derivative, commodity, cryptocurrency, or financial instrument. All intellectual property, including but not limited to algorithms, report structures, proprietary formats, branding, and system outputs, is strictly protected under applicable intellectual property laws. Unauthorized reproduction, redistribution, modification, or commercial exploitation is strictly prohibited and may result in civil and criminal legal action.