If you are a trader who relies on fundamental analysis to gauge the intrinsic value of an investment, TradingView has a powerful tool designed just for you. In a recent tutorial, the TradingView team introduced the Fundamental Graphs feature—an analytical tool that lets you visualize and compare key financial metrics over time.
Here is a breakdown of what this tool offers and how you can use it to spot undervalued or high-growth opportunities.
Fundamental Graphs are designed to help you evaluate a company’s health by plotting critical financial data points directly from official documents like income statements, balance sheets, and cash flow reports. Instead of reading through rows of numbers, you can see the trends visually. This helps you determine if a stock is overvalued, undervalued, or poised for future growth.
Accessing the tool is simple:
Once open, you can customize your view to analyze single or multiple companies. The tutorial demonstrates this by comparing major players like Visa, Mastercard, and Bank of America.
The tool offers a high degree of flexibility in how you display data:
To make the data easier to interpret, the tool provides four different scaling options:
By combining Fundamental Graphs with other TradingView tools like the Stock Screener, you can build a complete picture of the market. Whether you are looking for revenue growth trends or comparing asset bases across an industry, this feature turns complex financial data into clear, actionable insights.
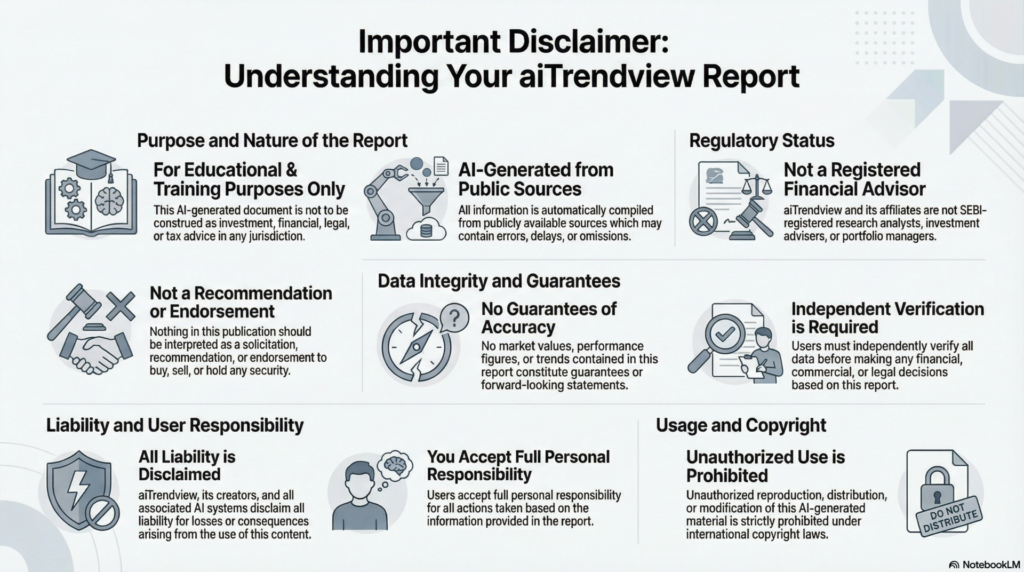
aiTrendview Global Disclaimer
This aiTrendview report is an AI-generated document provided exclusively for educational and training purposes and shall not be construed as investment, financial, legal, or tax advice in any jurisdiction.
aiTrendview and its affiliates are not SEBI-registered research analysts, investment advisers, or portfolio managers, and all information herein is automatically compiled from publicly available sources that may contain errors, delays, or omissions.
Users must independently verify all data before making any financial, commercial, or legal decisions, as no market values, performance figures, or trends contained in this report constitute guarantees or forward-looking statements.
Nothing in this publication should be interpreted as a solicitation, recommendation, or endorsement to buy, sell, or hold any security.
aiTrendview, its creators, and all associated AI systems disclaim all liability for losses or consequences arising from the use or reliance upon this content, and users accept full personal responsibility for all actions taken based on it.
Unauthorized reproduction, distribution, or modification of this AI-generated material is strictly prohibited under international copyright, compliance, and intellectual-property laws.