Mastering Momentum: A Guide to the Ultimate Oscillator on TradingView
Oscillators are powerful tools for spotting momentum shifts, but many traders find that indicators like the RSI can give false signals because they only analyze one specific time period. In a recent video, the TradingView channel breaks down the Ultimate Oscillator, an indicator designed specifically to solve this problem by blending multiple timeframes into one clear momentum line.
Here is a summary of how the Ultimate Oscillator works, how to set it up, and how to use it for divergence and confirmation.
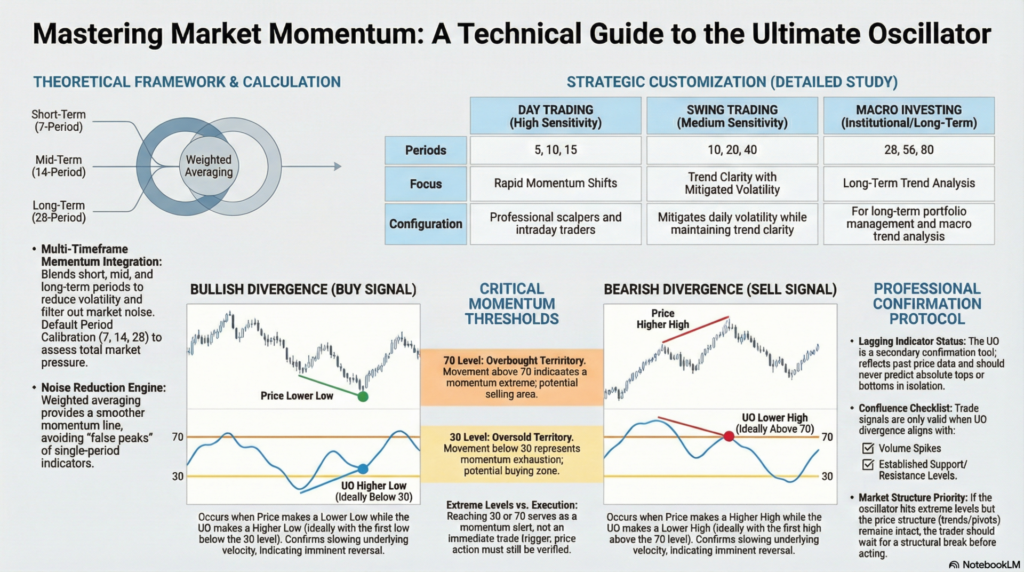
Developed to give a more accurate picture of buying and selling pressure, the Ultimate Oscillator combines three different periods of momentum into a single calculation.
The default settings (7, 14, 28) are a great starting point, but the video emphasizes that you can and should adjust these based on your trading style:
The video recommends adding two horizontal reference lines to your indicator panel to easily spot extremes:
The most powerful way to use this tool is by hunting for Divergences. Divergence occurs when the price of the asset disagrees with the momentum indicator.
The tutorial ends with a vital piece of advice: The Ultimate Oscillator is a lagging indicator and a confirmation tool, not a standalone signal. It does not magically predict tops and bottoms.
By adding the Ultimate Oscillator to your TradingView setup, you can gain a multi-timeframe perspective on market momentum and spot high-probability divergence setups.
Legal Disclaimer & Liability Waiver
This AI-generated report is strictly educational and does not constitute financial, legal, or professional advice. aiTrendview and its affiliates are not SEBI-registered advisors and assume zero liability for any losses or consequences resulting from its use. All data is autonomously harvested from public sources and may be flawed, delayed, or incomplete; therefore, you assume exclusive responsibility for independently verifying information before taking any action. Under no circumstances should this content be construed as a recommendation to trade or speculate in any security. By accessing this material, you acknowledge that any reliance on this data is at your sole risk, and you agree to be bound by strict intellectual property protections prohibiting the unauthorized redistribution or modification of this work.