

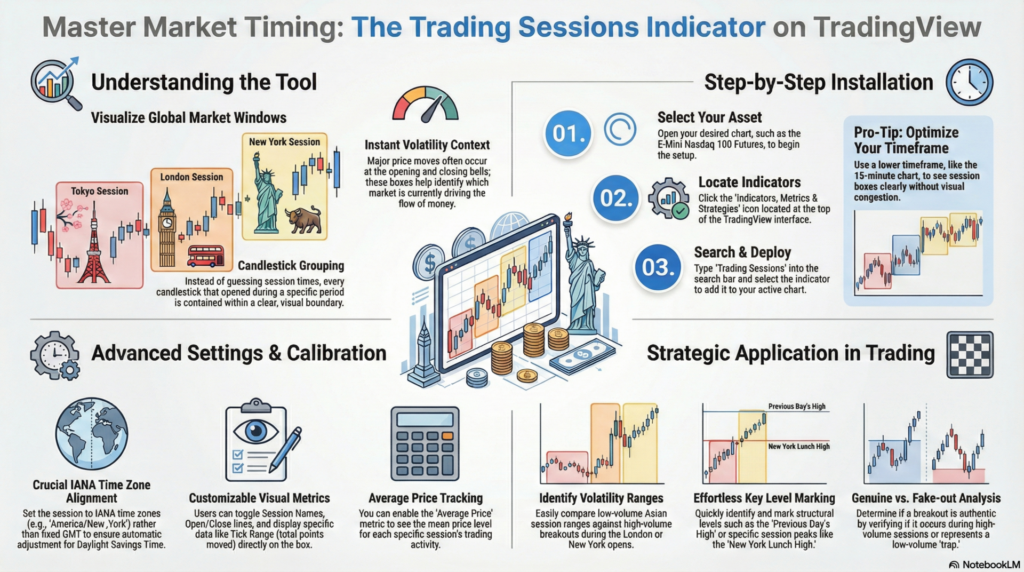
If you have ever looked at a chart and wondered why volatility suddenly spiked or dropped, the answer often lies in which global market is currently open. A recent tutorial on the TradingView channel introduces a powerful, free tool to help you visualize this instantly: the Trading Sessions Indicator.
Here is a breakdown of what this indicator does, how to set it up, and how it can bring critical context to your trading day.
At its core, this tool overlays colored boxes on your chart to represent specific time windows for major global markets (typically Tokyo, London, and New York).
Pro Tip: The video suggests using a lower timeframe, like the 15-minute chart, to see the session boxes clearly without congestion.
The tutorial highlights several customization options to make the tool fit your specific workflow:
While the indicator doesn’t provide buy or sell signals, it provides essential context:
By adding the Trading Sessions indicator to your toolkit, you remove the guesswork from market timing and gain a clearer understanding of the global flow of money.
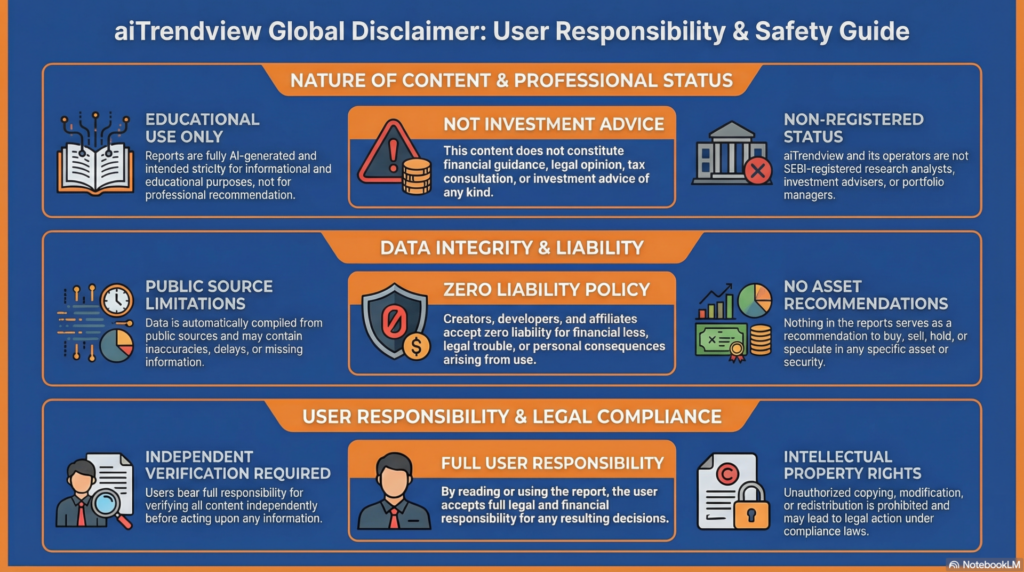
Legal Disclaimer & Liability Waiver
This AI-generated report is strictly educational and does not constitute financial, legal, or professional advice. aiTrendview and its affiliates are not SEBI-registered advisors and assume zero liability for any losses or consequences resulting from its use. All data is autonomously harvested from public sources and may be flawed, delayed, or incomplete; therefore, you assume exclusive responsibility for independently verifying information before taking any action. Under no circumstances should this content be construed as a recommendation to trade or speculate in any security. By accessing this material, you acknowledge that any reliance on this data is at your sole risk, and you agree to be bound by strict intellectual property protections prohibiting the unauthorized redistribution or modification of this work.