Tracking Dividends on TradingView

Tradingview, Technical, Fundamental, Economic, Market Report, Crypto Market Report, Commodity Market Report, Gold, Silver, Crudeoil, Nifty, Banknifty, Sensex, Forex,

Maximize Your Passive Income: Tracking Dividends on TradingView

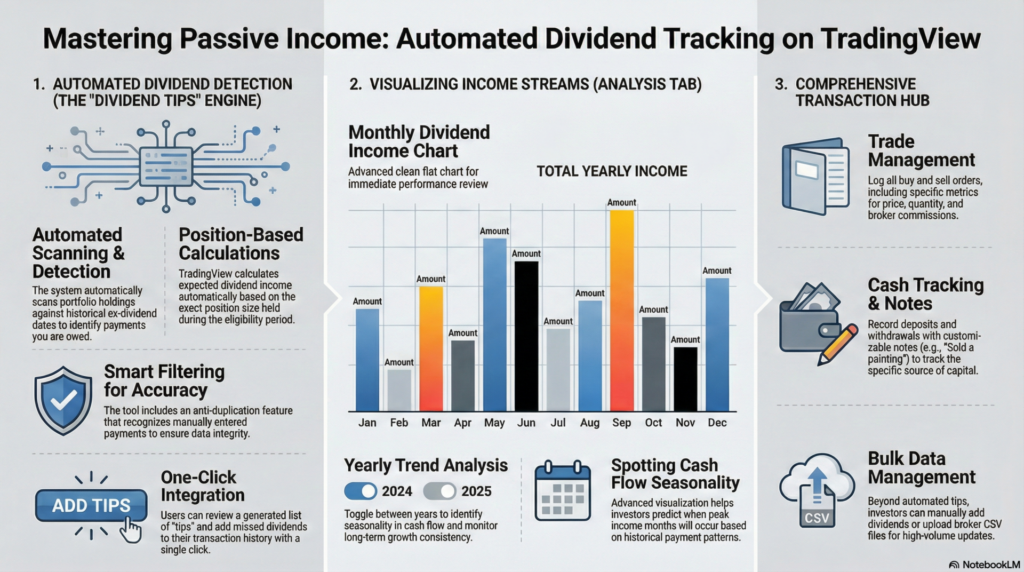
For income investors, tracking dividend payments can often be a tedious manual process involving spreadsheets and constant calendar checking. In a recent update, TradingView has supercharged its Portfolio tool with automated dividend detection and enhanced analytics, making it easier than ever to monitor your cash flow.

A recent tutorial on the TradingView channel walks users through these new features. Here is a summary of how to use them to streamline your investment tracking.

Automated Dividend Detection

The standout feature of this update is the “Dividend Tips” section. Instead of manually entering every payment, the system now scans your portfolio holdings against historical data to find missed dividends.

  • How it works: If you hold a stock through its ex-dividend date, TradingView automatically calculates what you are owed based on your position size.
  • Smart Filtering: It avoids duplicates. If you have already manually entered a payment, the system recognizes it and won’t double-count.
  • One-Click Add: You can review these “tips” in a list and add them to your portfolio transaction history with a single click.

Visualizing Your Income

Once your data is up to date, the Analysis tab offers powerful new ways to visualize your income stream.

  • Dividend Chart: A clean bar chart displays your total dividend income by month.
  • Yearly Trends: You can toggle between different years (e.g., 2024 vs. 2025) to spot trends. This helps you identify seasonality in your cash flow and see if your passive income is growing consistently over time.

comprehensive Transaction Management

The video also covers the basics of maintaining an accurate portfolio using the three core transaction types:

  1. Trades: Log your buy and sell orders, including price, quantity, and commission.
  2. Cash: Record deposits and withdrawals. You can add notes (e.g., “Sold a painting”) to track the source of your capital.
  3. Dividends: Beyond the automated tips, you can still manually add dividends or upload a CSV file from your broker for bulk updates.

By automating the tracking process and providing clear visual analytics, TradingView is transforming from just a charting platform into a robust all-in-one tool for managing your investment life.

Tradingview, Technical, Fundamental, Economic, Market Report, Crypto Market Report, Commodity Market Report, Gold, Silver, Crudeoil, Nifty, Banknifty, Sensex, Forex,

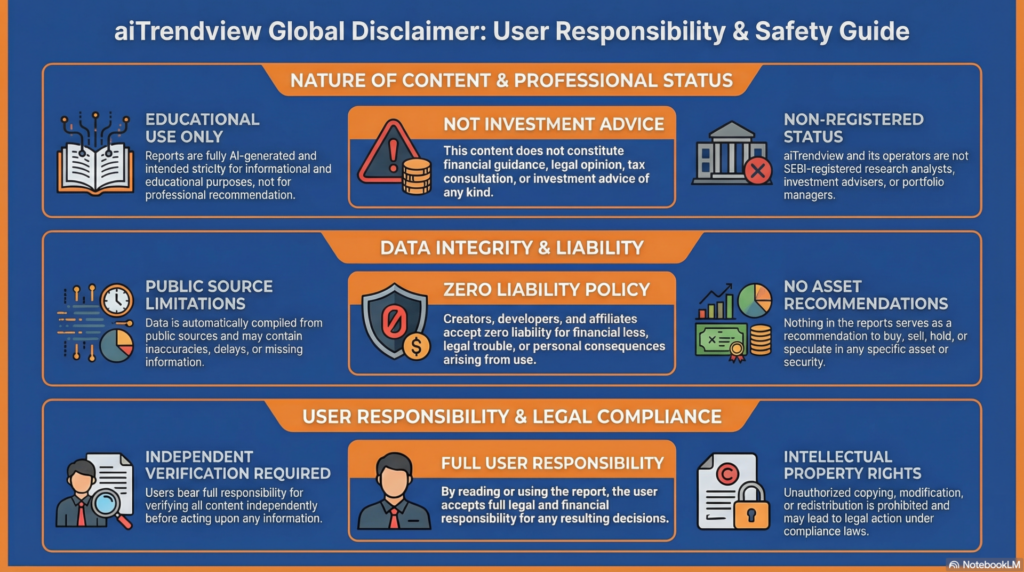
Legal Disclaimer & Liability Waiver

This AI-generated report is strictly educational and does not constitute financial, legal, or professional advice. aiTrendview and its affiliates are not SEBI-registered advisors and assume zero liability for any losses or consequences resulting from its use. All data is autonomously harvested from public sources and may be flawed, delayed, or incomplete; therefore, you assume exclusive responsibility for independently verifying information before taking any action. Under no circumstances should this content be construed as a recommendation to trade or speculate in any security. By accessing this material, you acknowledge that any reliance on this data is at your sole risk, and you agree to be bound by strict intellectual property protections prohibiting the unauthorized redistribution or modification of this work.

aiTrendview Disclaimer
Share this post :
Facebook
WhatsApp

Start To Invest And Earn More

Lorem ipsum dolor sit amet consectetur adipiscing elit dolor

Notice: Function WP_Scripts::add was called incorrectly. The script with the handle "hcaptcha-elementor-pro" was enqueued with dependencies that are not registered: hcaptcha. Please see Debugging in WordPress for more information. (This message was added in version 6.9.1.) in /var/www/vhosts/aitrendview.com/httpdocs/wp-includes/functions.php on line 6131