

Professional Technical Analysis Dashboard – Complete Guide
To access Tradingview Indicator for FREE Click Here
🎯 Overview
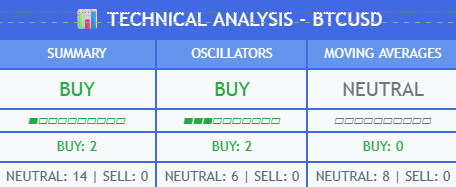
This is a comprehensive, institutional-grade technical analysis dashboard that combines multiple proven indicators into a single, visually stunning interface. It provides real-time market sentiment analysis through three critical categories: Summary, Oscillators, and Moving Averages, all displayed in a professional royal blue and white theme with intuitive progress indicators.
🔬 Technical Foundation & Methodology
📈 Summary Section – The Master Signal
The Summary section is the crown jewel of this dashboard, combining all 16 individual indicators into one powerful, unified signal.
What It Does:
• Aggregates 16 Technical Indicators: Combines 8 oscillators + 8 moving averages
• Weighted Scoring System: Each indicator contributes equally to the final score
• Real-Time Analysis: Updates with every bar close for current market conditions
• Universal Compatibility: Works on any symbol (stocks, forex, crypto, commodities)
How It Works:
Summary Score = Oscillator Signals + Moving Average Signals
Range: -16 to +16
├── Strong Buy: +6 to +16 (Green)
├── Buy: +2 to +5 (Light Green)
├── Neutral: -1 to +1 (Gray)
├── Sell: -5 to -2 (Light Red)
└── Strong Sell: -16 to -6 (Red)
Trading Advantages:
✅ Quick Decision Making: One glance tells you market sentiment
✅ Reduces Analysis Paralysis: No need to check 16 indicators individually
✅ Higher Accuracy: Multiple confirmations reduce false signals
✅ Risk Management: Clear zones help position sizing decisions
✅ Time Efficient: Perfect for busy traders managing multiple positions
When To Use Summary:
• Entry Decisions: Strong Buy/Sell signals for new positions
• Portfolio Overview: Quick assessment of multiple holdings
• Risk Assessment: Understanding overall market bias
• Position Sizing: Stronger signals warrant larger positions
⚡ Oscillators Section – Market Momentum Analysis
The Oscillators section focuses on momentum and overbought/oversold conditions, using 8 powerful momentum indicators.
Included Indicators & Their Purposes:
1. RSI (Relative Strength Index) – 14 Period
• Purpose: Identifies overbought (>70) and oversold (<30) conditions
• Trading Signal: RSI > 70 = Sell | RSI < 30 = Buy
• Best For: Mean reversion strategies, divergence analysis
2. Stochastic Oscillator – 14 Period
• Purpose: Compares closing price to price range over time
• Trading Signal: >80% = Overbought | <20% = Oversold
• Best For: Short-term swing trading, momentum confirmation
3. CCI (Commodity Channel Index) – 20 Period
• Purpose: Measures deviation from statistical mean
• Trading Signal: >100 = Sell | <-100 = Buy
• Best For: Cycle analysis, breakout confirmation
4. Williams %R – 14 Period
• Purpose: Momentum oscillator measuring closing vs. high-low range
• Trading Signal: >-20 = Overbought | <-80 = Oversold
• Best For: Timing entries in trending markets.
5. MACD (Moving Average Convergence Divergence)
• Purpose: Trend-following momentum indicator
• Trading Signal: MACD Line > Signal Line = Buy | Below = Sell
• Best For: Trend identification, momentum shifts.
6. Momentum – 10 Period
• Purpose: Rate of price change over specified period
• Trading Signal: Positive = Bullish | Negative = Bearish
• Best For: Early trend detection, momentum confirmation
7. ROC (Rate of Change) – 9 Period
• Purpose: Percentage change in price over time
• Trading Signal: >2% = Buy | <-2% = Sell
• Best For: Identifying acceleration in price movements
8. Bollinger Bands – 20 Period, 2 StdDev
• Purpose: Volatility-based support/resistance levels
• Trading Signal: Above Upper Band = Sell | Below Lower Band = Buy
• Best For: Volatility trading, mean reversion strategies
Oscillator Trading Advantages:
✅ Timing Precision: Excellent for entry/exit timing
✅ Overbought/Oversold Detection: Identifies potential reversals
✅ Divergence Analysis: Spots weakening trends early
✅ Short-Term Focus: Perfect for day trading and swing trading
✅ Momentum Confirmation: Validates trend strength
When Oscillators Are Most Effective:
• Range-Bound Markets: Excellent for buying dips, selling peaks
• Reversal Trading: High probability setups at extreme levels
• Momentum Trading: Confirming breakouts and trend acceleration
• Risk Management: Avoiding entries at poor risk/reward levels
________________________________________
📊 Moving Averages Section – Trend Analysis
The Moving Averages section provides trend identification and direction, using 8 different moving averages across multiple timeframes.
Included Moving Averages:
Simple Moving Averages (SMA):
• SMA 10: Very short-term trend (2 weeks of daily data)
• SMA 20: Short-term trend (1 month of daily data)
• SMA 50: Medium-term trend (2.5 months of daily data)
• SMA 100: Long-term trend (5 months of daily data)
• SMA 200: Major trend (10 months of daily data)
Exponential Moving Averages (EMA):
• EMA 10: Responsive short-term trend
• EMA 20: Responsive medium-term trend
• EMA 50: Responsive long-term trend
Signal Logic:
Price vs Moving Average Analysis:
├── Strong Buy: Price > MA by 2%+ (Strong uptrend)
├── Buy: Price > MA by 0-2% (Mild uptrend)
├── Neutral: Price ≈ MA (Sideways/transition)
├── Sell: Price < MA by 0-2% (Mild downtrend)
└── Strong Sell: Price < MA by 2%+ (Strong downtrend)
Moving Average Trading Advantages:
✅ Trend Identification: Clear bullish/bearish bias
✅ Support/Resistance: MAs act as dynamic support/resistance
✅ Multi-Timeframe Analysis: Short to long-term perspectives
✅ Position Management: Trend following for position sizing
✅ Market Context: Understanding broader market direction
Strategic Applications:
• Trend Following: Buy above MAs, sell below MAs
• Support/Resistance Trading: MAs as dynamic levels
• Position Management: Trailing stops using moving averages
• Market Bias: Understanding institutional positioning
🎯 Step-by-Step Trading Guide for New Traders
Phase 1: Dashboard Setup (5 Minutes)
Step 1: Installation
1. Copy the Pine Script code
2. Open TradingView Pine Editor
3. Paste code and click “Add to Chart”
4. The dashboard appears at bottom center
Step 2: Initial Configuration
1. Size Selection: Choose “Normal” for balanced view
2. Enable All Sections: Keep Summary, Oscillators, and MAs enabled
3. Progress Bars: Keep enabled for visual clarity
4. Timeframe: Start with “60” (1-hour analysis)
Step 3: Visual Verification
• Confirm dashboard shows at bottom center
• Verify all three sections are visible
• Check that progress bars are displaying
• Ensure colors are clear (green=bullish, red=bearish)
Phase 2: Understanding the Signals (10 Minutes Practice)
Step 1: Summary Section Reading
Practice Exercise: Look at 5 different stocks and note:
• What color is the signal? (Green=Buy, Red=Sell, Gray=Neutral)
• What’s the text saying? (Strong Buy, Buy, Neutral, Sell, Strong Sell)
• How filled is the progress bar? (More filled = stronger signal)
Example Reading:
SUMMARY: BUY (Green text)
Progress: ▰▰▰▰▰▰▱▱▱▱ (60% filled, positive)
BUY: 8 | NEUTRAL: 4 | SELL: 4
Interpretation: Moderately bullish, 8 indicators bullish vs 4 bearish
Step 2: Oscillator Analysis
Key Questions to Ask:
• Is the oscillator signal the same as summary?
• Are we in overbought territory (red signal)?
• Are we in oversold territory (green signal)?
• Is momentum building (progress bar filling)?
Trading Application:
• Green Oscillator + Green Summary = High probability buy
• Red Oscillator + Red Summary = High probability sell
• Conflicting signals = Wait for clarity
Step 3: Moving Average Confirmation
Trend Analysis Checklist:
• What’s the MA signal? (Bullish/Bearish)
• Does it match the summary?
• How strong is the trend? (Progress bar intensity)
• Are we trading with or against the trend?
Phase 3: Practical Trading Application (Real Trading)
Strategy 1: Conservative Confirmation Trading
Entry Rules (Low Risk):
1. All three sections must agree (Summary, Oscillators, MAs)
2. Signal strength >60% (progress bars more than half filled)
3. Wait for “Strong Buy” or “Strong Sell” signals only
4. Enter in direction of strongest signal
Example:
Summary: STRONG BUY (▰▰▰▰▰▰▰▰▱▱)
Oscillators: BUY (▰▰▰▰▰▱▱▱▱▱)
Moving Averages: STRONG BUY (▰▰▰▰▰▰▰▰▰▱)
Action: LONG position with high confidence
Strategy 2: Scalping with Oscillators
Entry Rules (Active Trading):
1. Focus primarily on Oscillator section
2. Look for oversold (strong green) for buys
3. Look for overbought (strong red) for sells
4. Use 5-15 minute timeframes
5. Quick exits when signal changes
Strategy 3: Trend Following with MAs
Entry Rules (Position Trading):
1. Moving Average section must be bullish for longs
2. Summary should confirm the trend
3. Use pullbacks in oscillators for entries
4. Hold positions while MAs remain favorable
________________________________________
Phase 4: Risk Management Integration
Position Sizing Based on Signal Strength
Signal Strength Guide:
├── 90-100% filled bars: 3-5% of capital (very high confidence)
├── 70-89% filled bars: 2-3% of capital (high confidence)
├── 50-69% filled bars: 1-2% of capital (moderate confidence)
└── <50% filled bars: No position or paper trade only
Stop Loss Placement
• Oscillator Trades: 2-3% stops (short-term)
• Trend Following: 5-8% stops (give room for noise)
• Strong Signal Trades: Tighter stops (1-2%)
Take Profit Strategy
• First Target: When signal changes from Strong to Normal
• Second Target: When signal goes neutral
• Full Exit: When signal reverses completely
________________________________________
🏆 Advanced Trading Applications
Multi-Timeframe Analysis
Professional Technique:
1. Daily Chart: Check overall trend (MAs section)
2. 1-Hour Chart: Find entry timing (Oscillators)
3. 15-Minute Chart: Precise entry execution
Divergence Trading
Advanced Setup:
• Price makes new highs but Oscillators show weakness
• Price makes new lows but Oscillators show strength
• High probability reversal signals
Market Correlation Analysis
Portfolio Management:
• Check dashboard on multiple correlated assets
• Look for broad market agreement or divergence
• Adjust position sizes based on correlation
🚨 Common Mistakes to Avoid
Beginner Errors:
❌ Trading against all three signals (very low probability)
❌ Ignoring progress bar intensity (signal strength matters)
❌ Using wrong timeframe (scalping on daily signals)
❌ Over-leveraging on weak signals (<50% progress bars)
❌ Not waiting for confirmation (jumping on first green/red)
Proper Approach:
✅ Wait for alignment between sections
✅ Use signal strength for position sizing
✅ Match timeframe to trading style
✅ Start small while learning the system
✅ Keep trading journal of signal accuracy
________________________________________
📊 Performance Optimization Tips
Best Timeframes for Different Strategies:
• Scalping: 5-15 minute analysis
• Day Trading: 15-60 minute analysis
• Swing Trading: 1-4 hour analysis
• Position Trading: Daily analysis
Market Condition Adaptation:
• Trending Markets: Focus on MA section, use oscillator pullbacks
• Range-Bound Markets: Focus on oscillator extremes
• High Volatility: Reduce position sizes, wait for stronger signals
• Low Volatility: Can take moderate signals with proper stops
🎯 Success Metrics & Tracking
Key Performance Indicators:
• Signal Accuracy: Track win rate by signal strength
• Risk-Adjusted Returns: Profit per unit of risk taken
• Signal Consistency: How well signals align across sections
• Market Condition Performance: Which signals work best when
Recommended Practice Routine:
1. Daily Review: Check dashboard on 5-10 watchlist stocks
2. Signal Logging: Note signal strength and outcomes
3. Weekly Analysis: Review which signals performed best
4. Monthly Optimization: Adjust strategy based on performance data
This Professional Technical Analysis Dashboard represents a complete trading solution that combines institutional-grade analysis with retail trader accessibility. By following this comprehensive guide, traders of all experience levels can harness the power of 16 technical indicators through one beautiful, intuitive interface. 🚀📈
Remember: Consistent profitability comes from disciplined application of proven systems, proper risk management, and continuous learning from market feedback.


