If you are looking for a versatile tool that combines trend following with momentum analysis, the Moving Average Convergence Divergence (MACD) is a must-know indicator. A recent educational tutorial from the TradingView team breaks down exactly what this tool is, how to set it up, and how to use it to identify strength, direction, and potential trend changes in the market.
Here is a summary of the key takeaways from the video.
At its core, the MACD measures the relationship between two moving averages of an asset’s price. It is displayed as an oscillator beneath your main price chart and consists of three main components:
Getting the MACD on your TradingView chart is simple:
The tutorial highlights two primary ways to trade using the MACD:
1. The Signal Line Crossover
2. The Center Line Crossover
While the MACD is powerful, the video emphasizes that it is a lagging indicator based on past prices.
The standard settings (12, 26, 9) work for most, but the tool is highly flexible. Whether you are scalping on a 1-minute chart or investing on a monthly timeframe, you can adjust the inputs to match your specific trading style.
By understanding the mechanics behind the MACD, you can use it to gauge market energy and make more informed decisions, provided you filter your trades with proper confirmation.
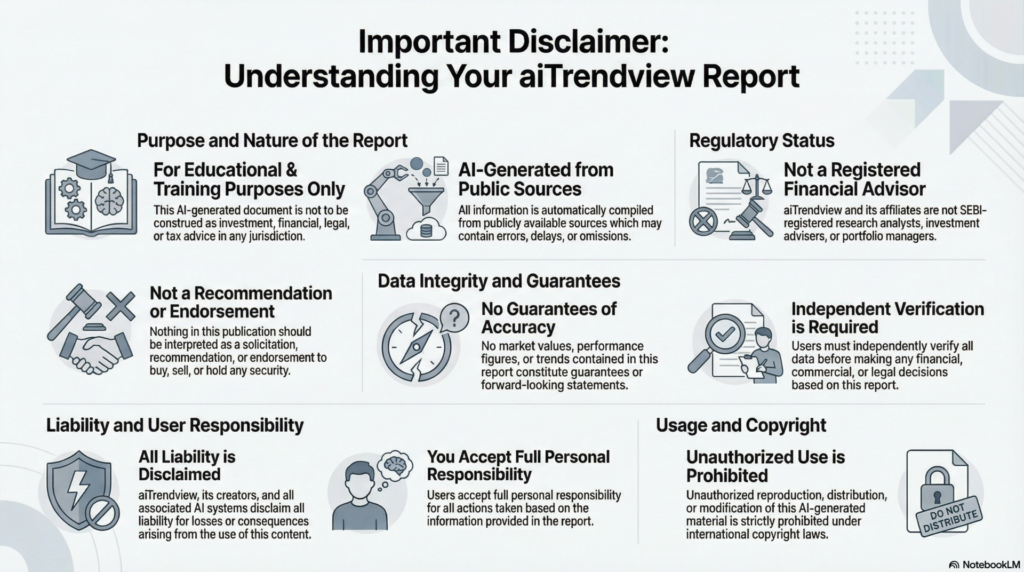
aiTrendview Global Disclaimer
This aiTrendview report is an AI-generated document provided exclusively for educational and training purposes and shall not be construed as investment, financial, legal, or tax advice in any jurisdiction.
aiTrendview and its affiliates are not SEBI-registered research analysts, investment advisers, or portfolio managers, and all information herein is automatically compiled from publicly available sources that may contain errors, delays, or omissions.
Users must independently verify all data before making any financial, commercial, or legal decisions, as no market values, performance figures, or trends contained in this report constitute guarantees or forward-looking statements.
Nothing in this publication should be interpreted as a solicitation, recommendation, or endorsement to buy, sell, or hold any security.
aiTrendview, its creators, and all associated AI systems disclaim all liability for losses or consequences arising from the use or reliance upon this content, and users accept full personal responsibility for all actions taken based on it.
Unauthorized reproduction, distribution, or modification of this AI-generated material is strictly prohibited under international copyright, compliance, and intellectual-property laws.