

Executive Summary & Market Outlook
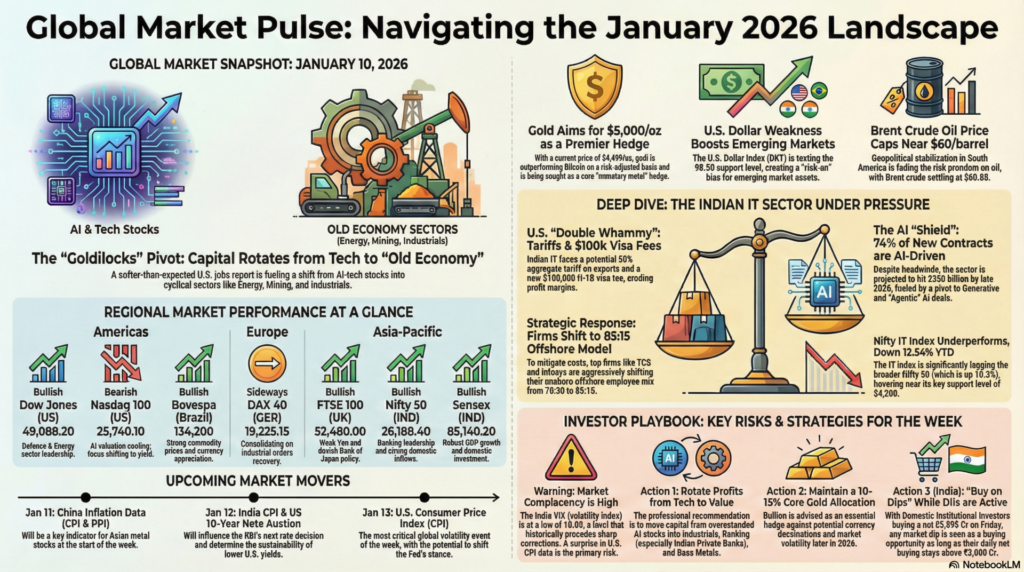
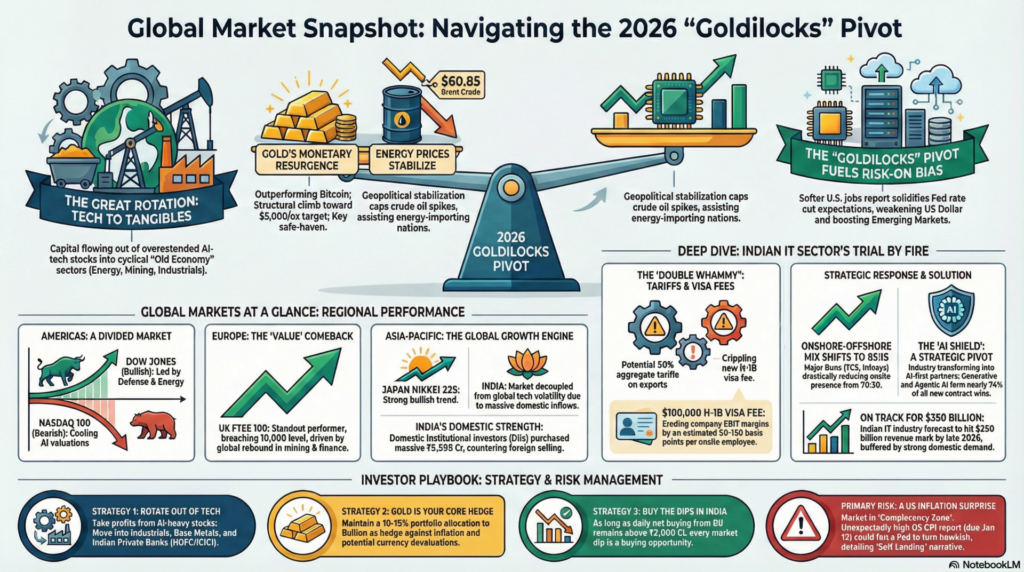
As of January 10, 2026, the global financial landscape is navigating a delicate “reacceleration” phase. Markets are currently digesting a cooling U.S. labor market—following a softer-than-expected Non-Farm Payroll (NFP) report—which has solidified expectations for a Federal Reserve rate cut cycle later this quarter. While equity indices in the U.S. and Japan are hovering near psychological resistance levels (Dow 49k and Nikkei 52k), a distinct rotation is visible: capital is flowing out of overextended AI-tech plays and into cyclical “Old Economy” sectors like Energy, Mining, and Industrials. This shift is further fueled by the geopolitical stabilization in South America, which has effectively capped crude oil spikes and provided a tailwind for energy-importing nations like India.
Looking ahead to January 11 and the week beyond, the market’s trajectory will be defined by “data dependency” rather than raw sentiment. Sunday night’s opening of the futures markets will likely reflect a cautious but optimistic carry trade as Treasury yields soften. We expect a “risk-on” bias for Emerging Markets (EM) as the U.S. Dollar Index (DXY) tests the 98.50 support. However, investors must remain wary of “valuation fatigue” in high-beta sectors. The primary theme for the coming sessions will be the search for yield in defensive industrials and precious metals, as gold continues its structural climb toward the $5,000/oz target.
| Index/Exchange | Status (Jan 10) | Closing/Live | Technical Analysis | Fundamental Driver |
| Dow Jones (NYSE) | Bullish | 49,088.20 | Testing 49,100 resistance; RSI at 68. | Defense & Energy leadership. |
| S&P 500 | Neutral | 6,912.45 | Forming a ‘Doji’ star; support at 6,850. | Balanced earnings expectations. |
| Nasdaq 100 | Bearish | 25,740.10 | Mean reversion toward 50-DMA. | AI valuation cooling/Yield focus. |
| Bovespa (Brazil) | Bullish | 134,200 | Breakout above 132k; Bullish MACD. | Commodities & Real appreciation. |
Analysis: The U.S. market is in a “melting up” phase. While tech is lagging, the “Trump-intervention” in Venezuela has turned defense and domestic energy into the primary engines of growth. Economic Data: NFP at 145k vs 175k expected has successfully lowered the 10-year yield to 3.85%, easing pressure on mortgage and corporate debt.
| Index/Exchange | Status (Jan 10) | Closing/Live | Technical Analysis | Fundamental Driver |
| FTSE 100 (UK) | Bullish | 10,012.40 | Breached 10,000; Support is now 9,950. | Mining & Finance surge. |
| DAX 40 (GER) | Sideways | 19,225.15 | Consolidating in a 200-pt range. | Industrial orders recovery. |
| CAC 40 (FRA) | Neutral | 8,245.80 | Testing 20-day EMA resistance. | Luxury sector bounce (LVMH). |
Analysis: Europe is witnessing a “Value” comeback. The UK’s FTSE 100 is the standout, benefiting from a global rebound in base metals. Economic Data: Eurozone CPI at 2.1% suggests the ECB will likely remain in a “hold” pattern, supporting the Euro (EUR/USD 1.1685).
| Index/Exchange | Status (Jan 10) | Closing/Live | Technical Analysis | Fundamental Driver |
| Nikkei 225 | Bullish | 52,480.00 | Strong trend continuity; Target 53,500. | Weak Yen & BoJ dovishness. |
| Hang Seng (HK) | Neutral | 26,410.50 | Bottom fishing; RSI divergence. | China Stimulus optimism. |
| Nifty 50 (IND) | Bullish | 26,188.40 | Support at 26,050; RSI Neutral. | Banking leadership/DII support. |
| Sensex (IND) | Bullish | 85,140.20 | Trendline breakout on hourly charts. | Robust GDP & Domestic Inflows. |
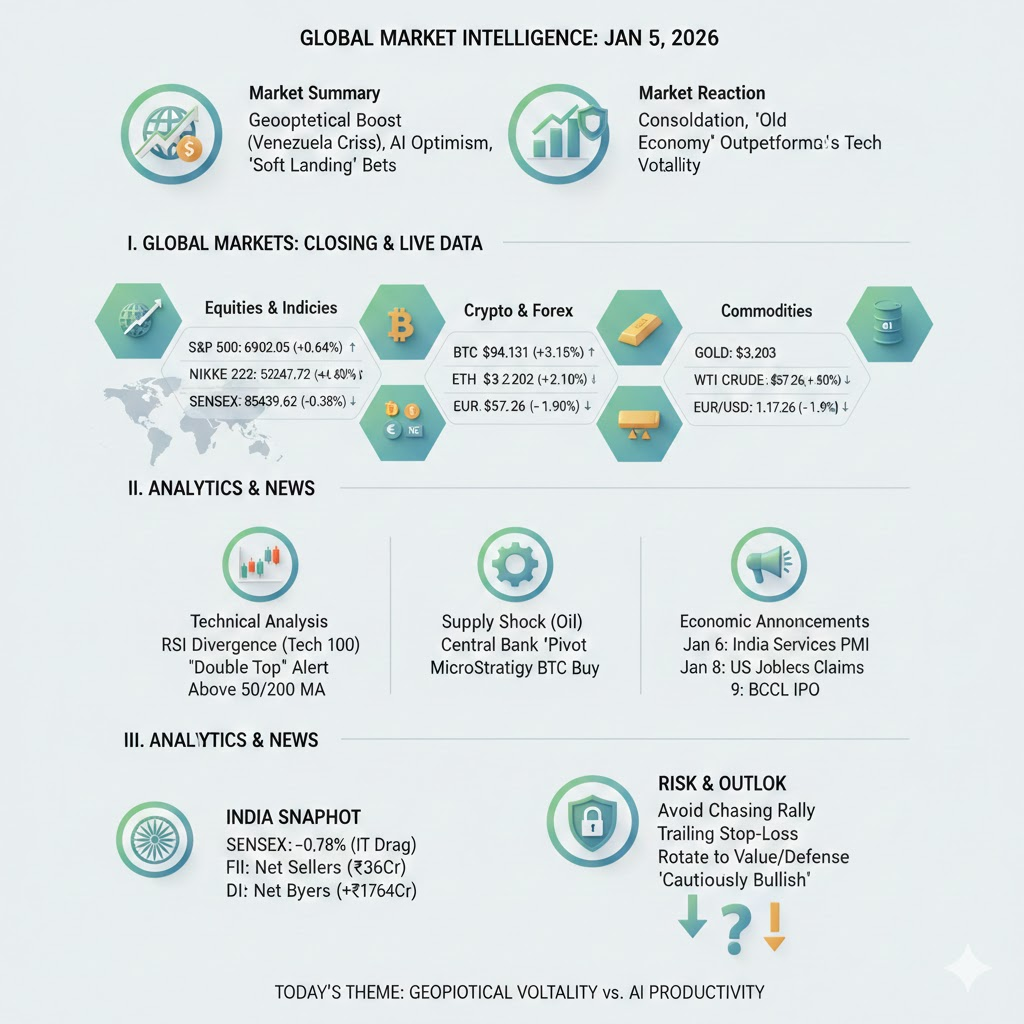
Analysis: Asia is the global “growth engine” for 2026. India Special: Despite FII selling of ₹3,769 Cr on Friday, DIIs countered with a massive ₹5,595 Cr purchase. The Indian market is decoupled from global tech volatility due to massive SIP (Systematic Investment Plan) inflows and a strengthening Rupee.
| Segment | Asset | Price / Rate | Technical View | Economic Announcement |
| Crypto | Bitcoin (BTC) | $91,450 | Testing $90k support base. | MicroStrategy BTC Treasury risk. |
| Forex | USD/INR | 89.78 | Rupee resilience; Target 89.50. | RBI Reserves at record highs. |
| Bullion | Gold (Spot) | $4,495 | Bullish Flag pattern; Target $4,600. | Safe haven demand vs inflation. |
| Energy | Brent Crude | $60.85 | Geopolitical premium fading. | Venezuela supply normalization. |
Technical Deep-Dive: Gold is behaving as a “monetary metal” again, outperforming Bitcoin on a risk-adjusted basis for the first time in crypto history. Traders should watch for the “Golden Cross” on the Silver chart (Spot $82.15).
The relationship between the Indian IT sector and the United States has entered a high-stakes era in 2026. With the U.S. accounting for approximately 54% of India’s IT export revenue, any shift in trade policy—especially the “reciprocal tariffs” and the unprecedented $100,000 H-1B visa fee—sends shockwaves through the Nifty IT index. While the broader Indian economy is projected to grow at 7.2% in FY26, the IT sector is currently the focal point of a strategic “tug-of-war” between protectionist headwinds and the AI-driven productivity boom.
The primary concern for 2026 is a tiered tariff structure that could reach an aggregate of 50% on certain Indian exports (combining baseline duties and reciprocal tariffs). While software services are traditionally less “tariff-vulnerable” than physical goods, the real pressure is coming from the cost of talent.
Despite the trade friction, the Indian IT industry is poised to hit the $350 billion mark by late 2026. This growth is underpinned by a “Digital Sovereign” shift:
The Nifty IT index has faced significant underperformance, showing a YTD return of -12.54% compared to the Nifty 50’s +10.3%.
| Risk Factor | Impact | Mitigation Strategy |
| Visa Fee Hike | High Margin Pressure | Accelerate local hiring in US Tier-2 cities (12-18% increase). |
| Reciprocal Tariffs | Moderate Export Drag | Diversify into Europe and Middle East markets. |
| Currency Volatility | High Revenue Gain | Use USD/INR depreciation (near 90) as a natural hedge for margins. |
The Professional Takeaway:
The Indian IT sector is no longer a simple “low-cost labor” play.10 To survive the 2026 tariff regime, firms are transforming into AI-first engineering partners.11 For investors, the takeaway is clear: Avoid companies with high H-1B dependency and pivot toward those with strong “Nearshoring” capabilities in Mexico/Canada and high-value AI consulting margins. The sector is undergoing a “survival of the most innovative,” making stock selection more critical than ever.
Strategic Risk Analysis:
The market is currently in a “Complacency Zone” (India VIX at 10.02). Historically, such low volatility levels precede a “Black Swan” or a sharp 3-5% correction. The primary risk for January 11/12 is an upside surprise in US Inflation data, which would force the Fed to turn hawkish again, crashing the “Soft Landing” narrative.
The Professional Takeaway:
Conclusion: The global market is structurally bullish but tactically overextended. For January 11-12, adopt a “Buy on Dips” approach rather than “Breakout Trading.” Focus on assets with strong domestic earnings (India) and tangible industrial utility (Base Metals/Energy). Stay disciplined with your stop-losses at the 20-DMA across all major indices.
aiTrendview Global Disclaimer
This aiTrendview report is an AI-generated document provided exclusively for educational and training purposes and shall not be construed as investment, financial, legal, or tax advice in any jurisdiction.
aiTrendview and its affiliates are not SEBI-registered research analysts, investment advisers, or portfolio managers, and all information herein is automatically compiled from publicly available sources that may contain errors, delays, or omissions.
Users must independently verify all data before making any financial, commercial, or legal decisions, as no market values, performance figures, or trends contained in this report constitute guarantees or forward-looking statements.
Nothing in this publication should be interpreted as a solicitation, recommendation, or endorsement to buy, sell, or hold any security.
aiTrendview, its creators, and all associated AI systems disclaim all liability for losses or consequences arising from the use or reliance upon this content, and users accept full personal responsibility for all actions taken based on it.
Unauthorized reproduction, distribution, or modification of this AI-generated material is strictly prohibited under international copyright, compliance, and intellectual-property laws.


