

If you trade crypto derivatives, understanding market liquidations is essential. A recent tutorial on the TradingView YouTube channel breaks down the Liquidations Indicator, explaining what it is, how to set it up, and how to use it to spot potential market reversals.
Here is a summary of the key points to help you integrate this tool into your analysis.
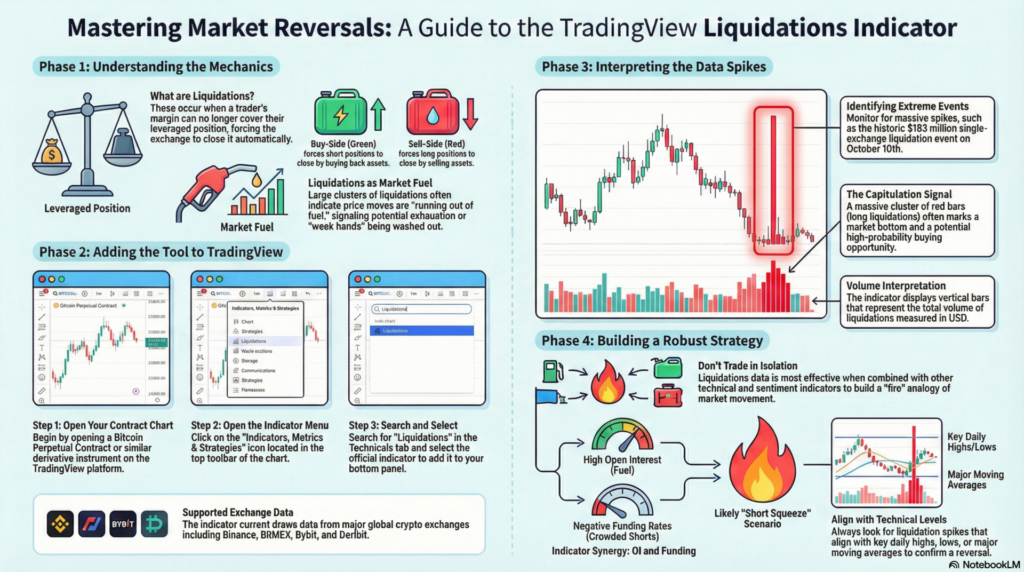
Liquidations occur when a leveraged position is forcibly closed by the exchange because the trader’s margin can no longer cover the position.
Note: This indicator currently supports data from major exchanges like Binance, BitMEX, Bybit, and Deribit.
The indicator displays vertical bars representing the volume of liquidations in USD.
The tutorial emphasizes that liquidations data should never be used in isolation. To build a robust strategy, combine it with:
By monitoring where traders are getting wrecked, you can avoid becoming one of them and instead identify high-probability reversal setups.
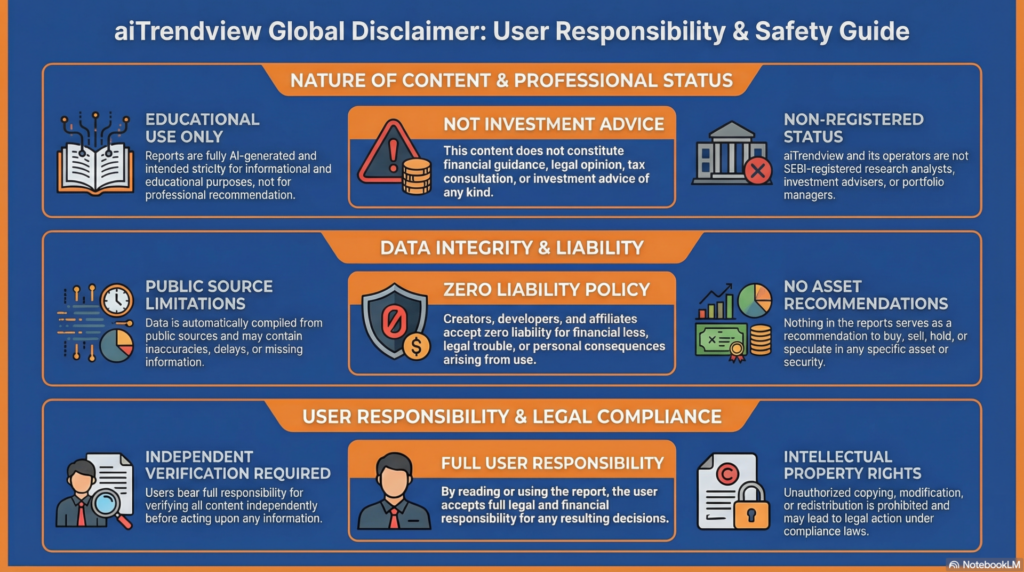
Legal Disclaimer & Liability Waiver
This AI-generated report is strictly educational and does not constitute financial, legal, or professional advice. aiTrendview and its affiliates are not SEBI-registered advisors and assume zero liability for any losses or consequences resulting from its use. All data is autonomously harvested from public sources and may be flawed, delayed, or incomplete; therefore, you assume exclusive responsibility for independently verifying information before taking any action. Under no circumstances should this content be construed as a recommendation to trade or speculate in any security. By accessing this material, you acknowledge that any reliance on this data is at your sole risk, and you agree to be bound by strict intellectual property protections prohibiting the unauthorized redistribution or modification of this work.