Ichimoku Cloud for Trend, Impulse, and Signals

Tradingview, Technical, Fundamental, Economic, Market Report, Crypto Market Report, Commodity Market Report, Gold, Silver, Crudeoil, Nifty, Banknifty, Sensex, Forex,

Demystifying the Ichimoku Cloud: A Complete Trading System on TradingView

Developed in Japan nearly a century ago, the Ichimoku Cloud (Ichimoku Kinko Hyo) translates to a “one-glance equilibrium chart.” Unlike standard indicators that plot a single line, the Ichimoku Cloud is a complete trading system designed to show support, resistance, trend direction, and momentum all at once.

Because it plots multiple lines and a shaded “cloud,” it can look intimidating at first glance. A recent TradingView tutorial breaks down each component to help you read this powerful indicator effectively. Here is a summary of how it works.

How to Add It to Your Chart

Tradingview, Technical, Fundamental, Economic, Market Report, Crypto Market Report, Commodity Market Report, Gold, Silver, Crudeoil, Nifty, Banknifty, Sensex, Forex,
  1. Open the Indicators menu at the top of your chart.
  2. Search for “IC” or “Ichimoku Cloud.”
  3. Select the indicator to apply it to your chart [01:11].(Note: The video recommends starting with the default settings and using higher timeframes, like the Daily or 4-Hour chart, to filter out noise [12:44].)

The 5 Components of the Ichimoku Cloud

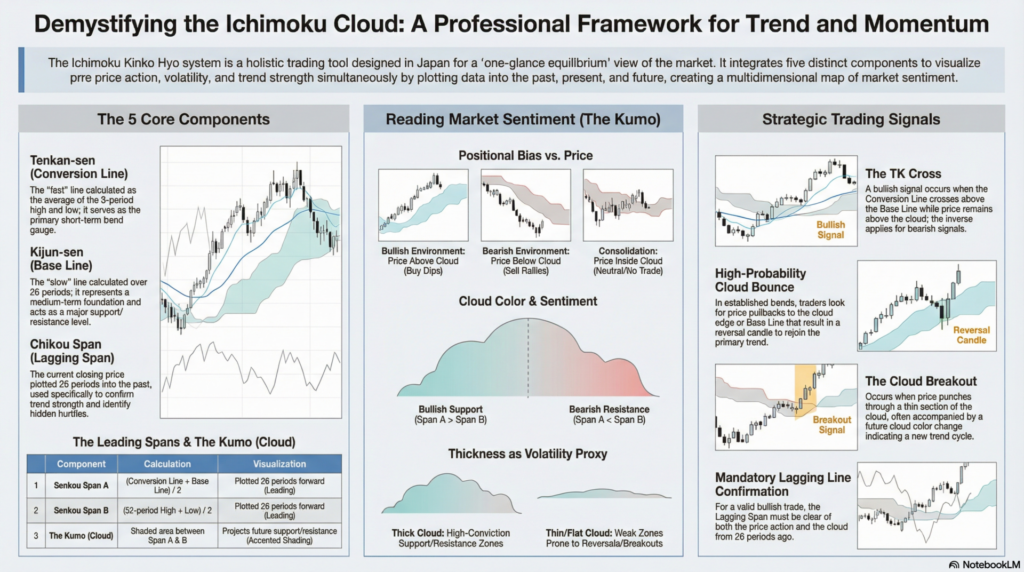
To understand the system, you must understand its individual pieces:

  1. Conversion Line (Tenkan-sen): The fast line (often blue). It calculates the average of the highest high and lowest low over the last 9 periods. It acts as a short-term trend gauge [02:09].
  2. Base Line (Kijun-sen): The slow line (often red). Calculated the same way but over 26 periods. It acts as a medium-term foundation and a stronger level of support/resistance [02:44].
  3. Leading Span A (Senkou Span A): The average of the Conversion Line and Base Line, plotted 26 periods into the future [03:01].
  4. Leading Span B (Senkou Span B): The average of the 52-period high and low, also plotted 26 periods into the future [03:29].
    • The Cloud (Kumo): The shaded area between Span A and Span B. This is the core of the indicator.
  5. Lagging Span (Chikou Span): Today’s closing price plotted 26 periods in the past (often green). This is a crucial line for confirming trend strength [04:00].

How to Read the Cloud (The Kumo)

The cloud projects future areas of support and resistance based on past price action [05:51].

  • Trend Direction:
    • Price above the cloud = Bullish (look to buy dips) [07:07].
    • Price below the cloud = Bearish (look to sell rallies) [06:24].
    • Price inside the cloud = Consolidating or transitioning (avoid trading) [07:41].
  • Cloud Color: A Green cloud (Span A > Span B) indicates bullish support. A Red cloud (Span A < Span B) indicates bearish resistance [04:32].
  • Cloud Thickness: A thick cloud represents a strong zone of support/resistance. A thin or flat cloud is weak and indicates a potential trend reversal or breakout [05:21].

Simple Trading Signals

The tutorial outlines a few standard setups using the components together:

  • The TK Cross: Similar to a moving average crossover. If the fast Conversion Line crosses above the slow Base Line while price is above the cloud, it’s a bullish signal. A cross below while under the cloud is a bearish signal [08:12].
  • Cloud Bounce: In a strong trend, wait for the price to pull back to the edge of the cloud or the Base Line. If it prints a reversal candle, it is a high-probability entry to rejoin the trend [11:34].
  • Cloud Breakout: Watch for price to punch through a thin part of the cloud. If the future cloud changes color shortly after, a new trend is likely beginning [11:53].
  • Lagging Line Confirmation: Never ignore the Lagging Span. For a valid bullish trade, you want this line to be plotted above both the price and the cloud. If price is rising but the Lagging Line is stuck below the cloud, the trend is weak and likely to reverse [15:04].

By mastering these rules, the Ichimoku Cloud transforms from a chaotic web of lines into a clear, “one-glance” roadmap of the market.


Legal Disclaimer & Liability Waiver

aiTrendview Disclaimer

This AI-generated report is strictly educational and does not constitute financial, legal, or professional advice. aiTrendview and its affiliates are not SEBI-registered advisors and assume zero liability for any losses or consequences resulting from its use. All data is autonomously harvested from public sources and may be flawed, delayed, or incomplete; therefore, you assume exclusive responsibility for independently verifying information before taking any action. Under no circumstances should this content be construed as a recommendation to trade or speculate in any security. By accessing this material, you acknowledge that any reliance on this data is at your sole risk, and you agree to be bound by strict intellectual property protections prohibiting the unauthorized redistribution or modification of this work.

Share this post :
Facebook
WhatsApp