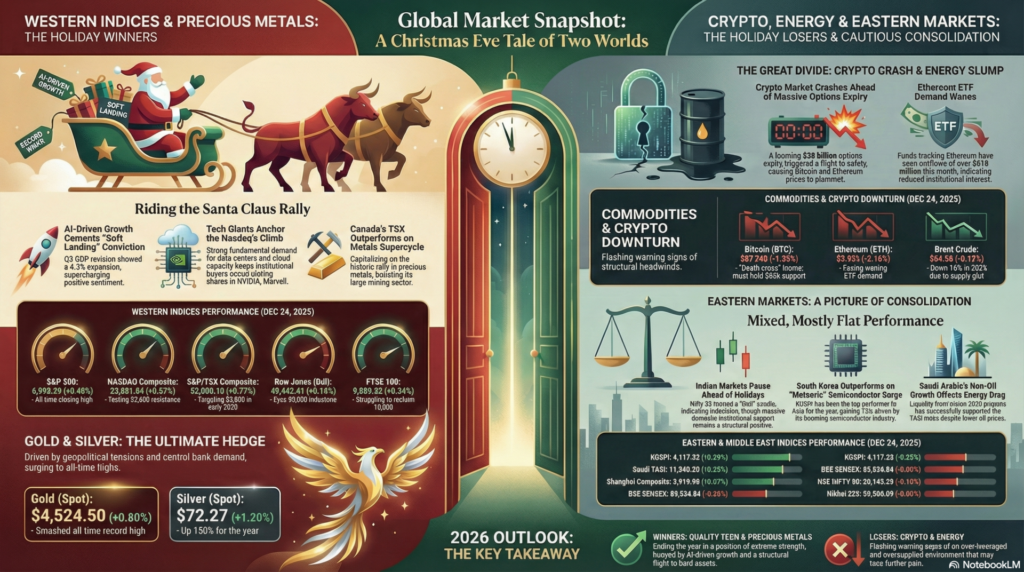
As the global financial community heads into the holiday break, the trading session on December 24, 2025, has been defined by extreme “dispersion.” While Western equity indices are coasting on a historic “Santa Claus Rally” following a year of blistering AI-driven gains, the cryptocurrency market is undergoing a sharp deleveraging phase. In a remarkable shift, gold and silver have decoupled from traditional risk assets to smash all-time records, serving as a powerful hedge against geopolitical uncertainty and a softening US Dollar.
Today’s session is marked by thin liquidity but high impact. With the US markets closing early at 1:00 PM EST and many global exchanges already winding down, the focus has shifted from macro-data to technical positioning for 2026. The “Goldilocks” narrative—strong GDP growth paired with the potential for central bank easing—remains the dominant fundamental floor, even as crypto and energy markets face structural headwinds. Below is the comprehensive live pulse of the world’s major asset classes for this final pre-Christmas session.
Western Indices: The Peak of the Rally
DOW JONES Industrial Average
Index
Closing/LTP (Dec 24)
Change (%)
Dow Jones (DJI)
48,442.41
+0.16%
Economic Event: The primary focus today was the release of Initial Jobless Claims, which came in at 223K (vs. 224K previous), signaling a labor market that remains robust enough to avoid recession but soft enough to keep the Fed’s easing path open for early 2026.
Fundamental Analysis: Blue-chip stability is the name of the game today. Financials led the late-session bid as investors rotate into high-quality value names to lock in 2025 gains. The index is benefiting from the “Trump Tariff” narrative being partially priced in, with industrial giants showing resilience despite trade-war rhetoric.
Technical Analysis: Technically, the Dow is holding firmly above its 20-day EMA. It remains within a stone’s throw of the 48,500 psychological barrier; a quiet holiday close above 48,400 sets the stage for a massive January “melt-up” toward the 50,000 milestone.
S&P 500 & NASDAQ Composite
Index
Closing/LTP (Dec 24)
Change (%)
S&P 500
6,909.79
+0.46%
NASDAQ Composite
23,561.84
+0.57%
Economic Event: Sentiment was supercharged by the final Q3 GDP revision showing a 4.3% expansion, far exceeding analyst expectations. This growth, largely driven by AI infrastructure spending and robust consumer consumption, has cemented the “soft landing” conviction for the festive period.
Fundamental Analysis: Tech bigwigs like Marvell Technology (+3.4%) and NVIDIA continue to anchor the Nasdaq, as the “AI Saga” is viewed as only partially unfolded. Despite high P/E ratios, the fundamental demand for data centers and cloud capacity remains the most “rock solid” trade in the global equity space.
Technical Analysis: The S&P 500 has notched a new all-time closing high today. For the Nasdaq, the immediate resistance at 23,600 is being tested; on a technical basis, the lack of significant “selling tails” on the daily candles suggests that institutional buyers are still accumulating on every minor dip.
Canada (TSX) & United Kingdom (FTSE 100)
Index
Closing/LTP (Dec 24)
Change (%)
S&P/TSX Composite
32,000.10
+0.77%
FTSE 100
9,889.22
+0.24%
Economic Event: The TSX is capitalizing on the historic rally in precious metals, with mining stocks providing the heavy lifting. In the UK, the FTSE 100 found late-session momentum as a slight dip in the Sterling provided a “relief valve” for the index’s large-cap multi-national exporters.
Fundamental Analysis: Canada’s heavy exposure to the “Metals Supercycle” has made it one of the best-performing Western indices this month. Conversely, the FTSE’s fundamentals remain tied to the energy sector, which is currently acting as a drag due to the long-term supply surplus in crude oil.
Technical Analysis: The FTSE 100 is struggling to reclaim the 10,000 mark, facing a “brick wall” of resistance at 9,950. The TSX looks far more bullish, having converted its 31,500 resistance into a floor, targeting a 33,000 run in the first week of 2026.
Asian & Middle Eastern Markets: Eastern Strength
India (Sensex & Nifty 50)
Index
Closing/LTP (Dec 24)
Change (%)
BSE SENSEX
85,524.84
-0.05%
NSE NIFTY 50
26,145.25
-0.10%
Economic Event: Indian markets traded with a flat-to-negative bias today as participants opted for caution ahead of the long weekend. The “nothingburger” Bank of Japan minutes provided no fresh catalysts for the broader Asian region, leaving the Nifty to oscillate based on domestic institutional flows.
Fundamental Analysis: While FIIs have been net sellers in early December, the structural story for India remains intact due to massive DII (Domestic Institutional Investor) support. The banking and IT sectors are currently in a “wait and watch” mode, looking for cues from the next US inflation print.
Technical Analysis: Technically, the Nifty 50 is forming a “Doji” on the daily chart, indicating indecision. Major support is localized at 25,900, while a breakout above 26,300 is required to trigger the next wave of retail FOMO.
China (SSE) & Japan (Nikkei 225)
Index
Closing/LTP (Dec 24)
Change (%)
Nikkei 225
50,383.05
-0.06%
Shanghai Composite
3,919.98
+0.07%
Economic Event: The Nikkei saw mild profit-taking after its massive rally to 50,000 earlier this week. In China, the market is treading water as the PBoC maintains its liquidity injections, though the lack of aggressive fiscal stimulus continues to cap the upside for the Shanghai Composite.
Fundamental Analysis: Japan’s “policy normalization” is being treated as a sign of economic health rather than a threat, attracting global capital seeking yield outside of USD assets. China remains a “value trap” for many, though the iron ore recovery suggests an industrial bottom may be forming.
Technical Analysis: The Nikkei is consolidating its gains; as long as it stays above 49,500, the long-term trend remains decisively bullish. The Shanghai Composite is facing heavy resistance at 3,950, needing a “catalyst event” to break its current year-end malaise.
Saudi Arabia (TASI) & South Korea (KOSPI)
Index
Closing/LTP (Dec 24)
Change (%)
Saudi TASI
11,540.20
+0.32%
KOSPI
4,117.32
+0.28%
Economic Event: Saudi markets are navigating a volatile energy environment, but local liquidity from Vision 2030 projects is keeping the TASI in the green. South Korea’s KOSPI is benefiting from the global tech tailwinds, despite the broader regional cooling in crypto assets.
Fundamental Analysis: South Korea has outperformed the rest of Asia for the year (+72%), driven by its “meteoric” semiconductor surge. Saudi Arabia’s fundamentals are currently pinned to the non-oil sector growth, which is successfully offsetting the 16% annual decline in Brent prices.
Technical Analysis: KOSPI is showing a classic “stair-step” recovery, with the next target at 4,250. The TASI is range-bound between 11,200 and 11,800, likely to remain there until the next OPEC+ meeting provides price direction.
Currencies, Crypto & Commodities
Forex & Crypto: The Digital Shakeout
Asset
Live Price (Dec 24)
Change (%)
DXY (Dollar Index)
97.84
-0.05%
EUR/USD
1.1805
+0.04%
Bitcoin (BTC)
$87,240
-1.35%
Ethereum (ETH)
$2,935
-2.10%
Economic Event: Crypto prices crashed today, erasing gains as the “Altcoin Season Index” plummeted to 17. The market is bracing for a massive $28 billion options expiry this Friday, which has triggered a flight to safety into traditional gold and the Yen.
Fundamental Analysis: High US GDP numbers have reduced the “urgency” for Fed rate cuts in 2026, which is inherently bearish for non-yielding digital assets. While Bitcoin remains the dominant player, demand for Ethereum ETFs has waned, with funds shedding over $510 million this month.
Technical Analysis: Bitcoin has a “death cross” looming on shorter timeframes; it must hold the $85,000 support to avoid a landslide to $78,000. EUR/USD is currently testing 1.1820, benefiting from the Dollar’s broad-based 10% annual decline.
Commodities: The Record-Breakers
Asset
Live Price (Dec 24)
Change (%)
Gold (Spot)
$4,524.50
+0.80%
Silver (Spot)
$72.27
+1.20%
WTI Crude
$58.55
+0.30%
Brent Crude
$62.56
-0.12%
Copper (LTP)
$5.51
+0.12%
Economic Event: Gold and Silver have smashed records today, with Silver set for its “best year ever” (+150%). Escalating geopolitical tensions—including US-Venezuela friction and drone strikes on Russian energy vessels—have added a heavy risk premium to the entire commodity complex.
Fundamental Analysis: Gold is being driven by “structural demand” from central banks and fears of debt monetization. In contrast, oil faces a third straight year of losses due to a supply-driven downtrend, with Brent prices down 16% for 2025 despite the recent geopolitical “risk bid.”
Technical Analysis: Silver is in “price-discovery territory” with analysts now eyeing $80 as a potential target for 2026. WTI Crude is hitting two-week highs but remains capped by a long-term bearish channel, requiring a sustained move above $60 to shift the trend.
The Takeaway Summary
As we close the books for Christmas Eve 2025, the market presents a tale of two worlds. Equities and Precious Metals are ending the year in a position of extreme strength, buoyed by AI-driven growth and a structural flight to hard assets. However, the Crypto and Energy markets are flashing warning signs of an oversupplied and over-leveraged environment. For the next week, expect low-volume volatility to continue; the safest harbors remain “quality tech” and “precious metals,” while high-beta crypto assets may face further pain until the year-end options expiry is cleared.
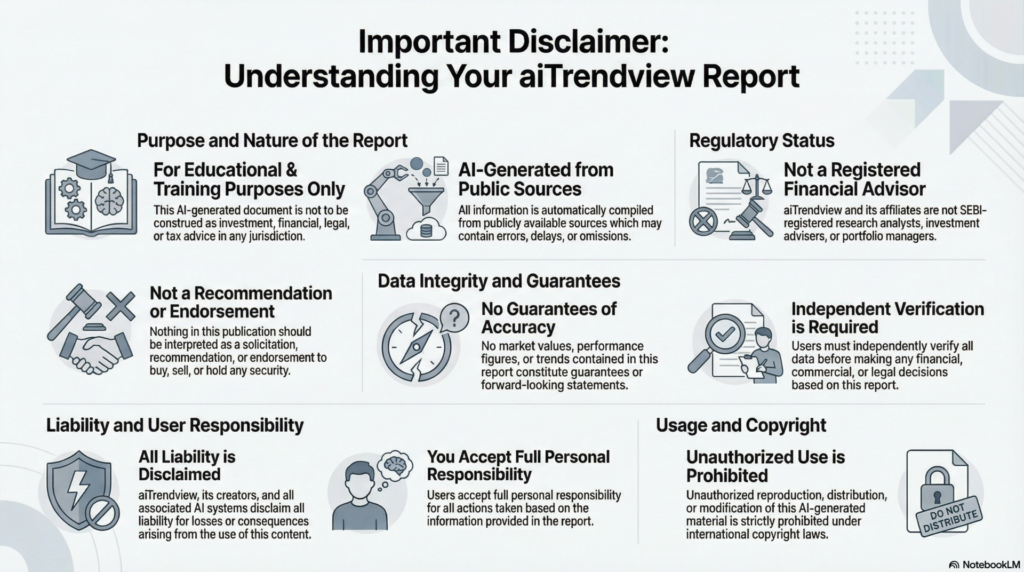
aiTrendview Global Disclaimer
This aiTrendview report is an AI-generated document provided exclusively for educational and training purposes and shall not be construed as investment, financial, legal, or tax advice in any jurisdiction.
aiTrendview and its affiliates are not SEBI-registered research analysts, investment advisers, or portfolio managers, and all information herein is automatically compiled from publicly available sources that may contain errors, delays, or omissions.
Users must independently verify all data before making any financial, commercial, or legal decisions, as no market values, performance figures, or trends contained in this report constitute guarantees or forward-looking statements.
Nothing in this publication should be interpreted as a solicitation, recommendation, or endorsement to buy, sell, or hold any security.
aiTrendview, its creators, and all associated AI systems disclaim all liability for losses or consequences arising from the use or reliance upon this content, and users accept full personal responsibility for all actions taken based on it.
Unauthorized reproduction, distribution, or modification of this AI-generated material is strictly prohibited under international copyright, compliance, and intellectual-property laws.