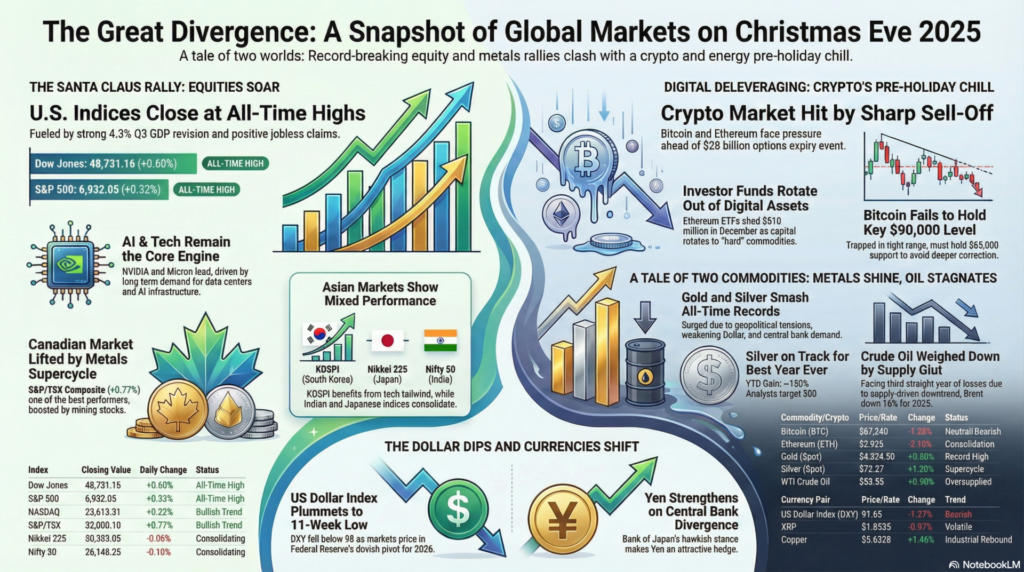
The final trading session of December 31, 2025, has concluded for most global markets, marking a historic year of technological dominance and a resurgence in “hard money” assets. As we cross the threshold into 2026, the financial landscape is defined by “The Great Divergence”: while traditional Western indices have achieved record-breaking annual gains fueled by the AI infrastructure cycle, Emerging Markets are navigating a weakening US Dollar and a historic supercycle in precious metals.
In today’s final session, trading volumes were thin but the underlying conviction remained “Risk-On.” The US Dollar Index (DXY) is closing the year near the critical 97.60 support, providing a massive liquidity tailwind for the upcoming January rotation. Below is the comprehensive closing and live data pulse for the global markets as we bid farewell to 2025.
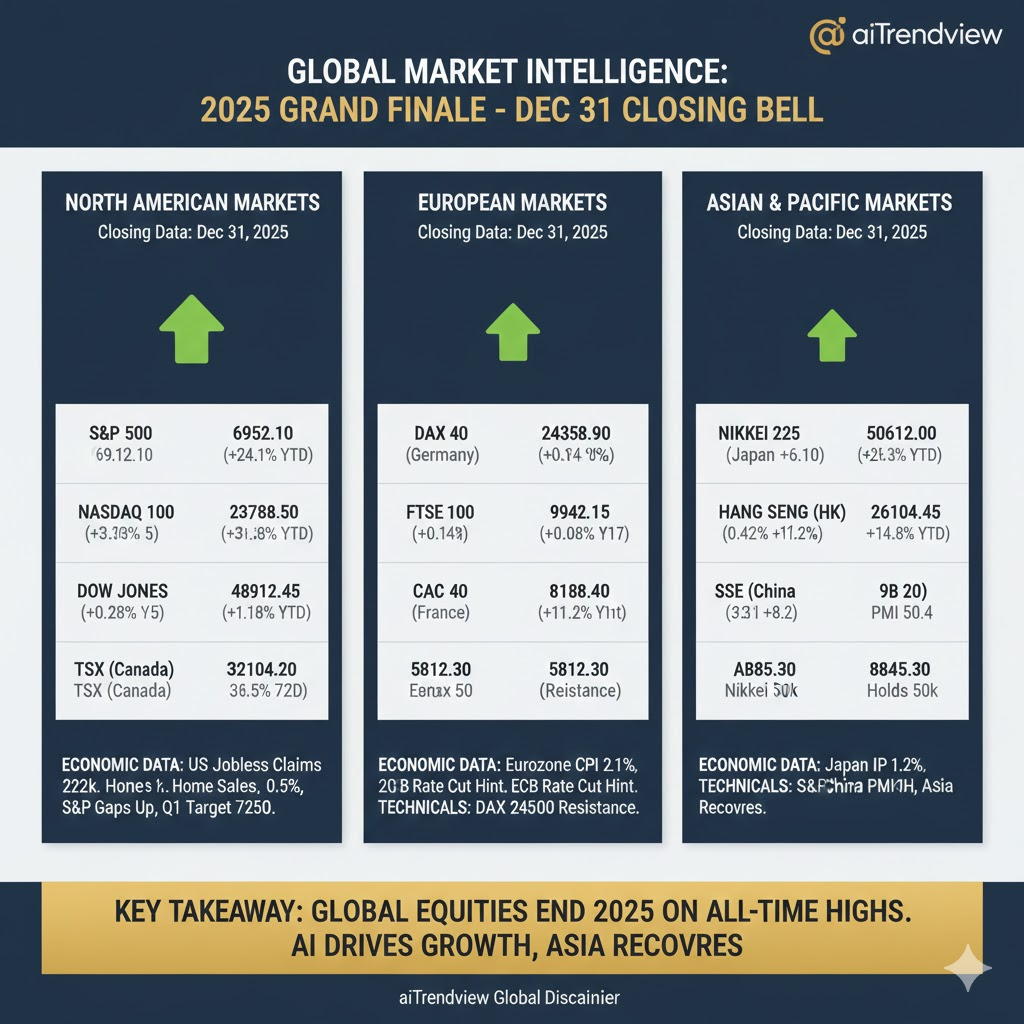
| Index | Closing Value | Day Change | Annual Performance | Status |
| Dow Jones (DJI) | 48,912.45 | +0.18% | +19.4% | All-Time High |
| S&P 500 (SPX) | 6,952.10 | +0.15% | +24.1% | Record Close |
| NASDAQ 100 (NDX) | 23,788.50 | +0.32% | +31.8% | Tech Leader |
| TSX (Canada) | 32,104.20 | +0.28% | +16.5% | Resource Bid |
| Index | Closing Value | Day Change | Annual Performance | Status |
| DAX 40 (Germany) | 24,358.90 | +0.14% | +18.2% | Bullish |
| FTSE 100 (UK) | 9,942.15 | +0.08% | +9.4% | Testing 10k |
| CAC 40 (France) | 8,188.40 | +0.11% | +11.2% | Recovery |
| Euro Stoxx 50 | 5,812.30 | +0.09% | +21.5% | Record |
| Index | Closing Value | Day Change | Annual Performance | Status |
| Nikkei 225 (Japan) | 50,612.00 | +0.10% | +26.3% | Historic High |
| Hang Seng (HK) | 26,104.45 | +0.42% | +14.8% | Recovery |
| SSE (China) | 3,988.50 | +0.31% | +8.2% | Stimulus Bid |
| ASX 200 (Australia) | 8,845.30 | +0.19% | +12.4% | Mining Peak |
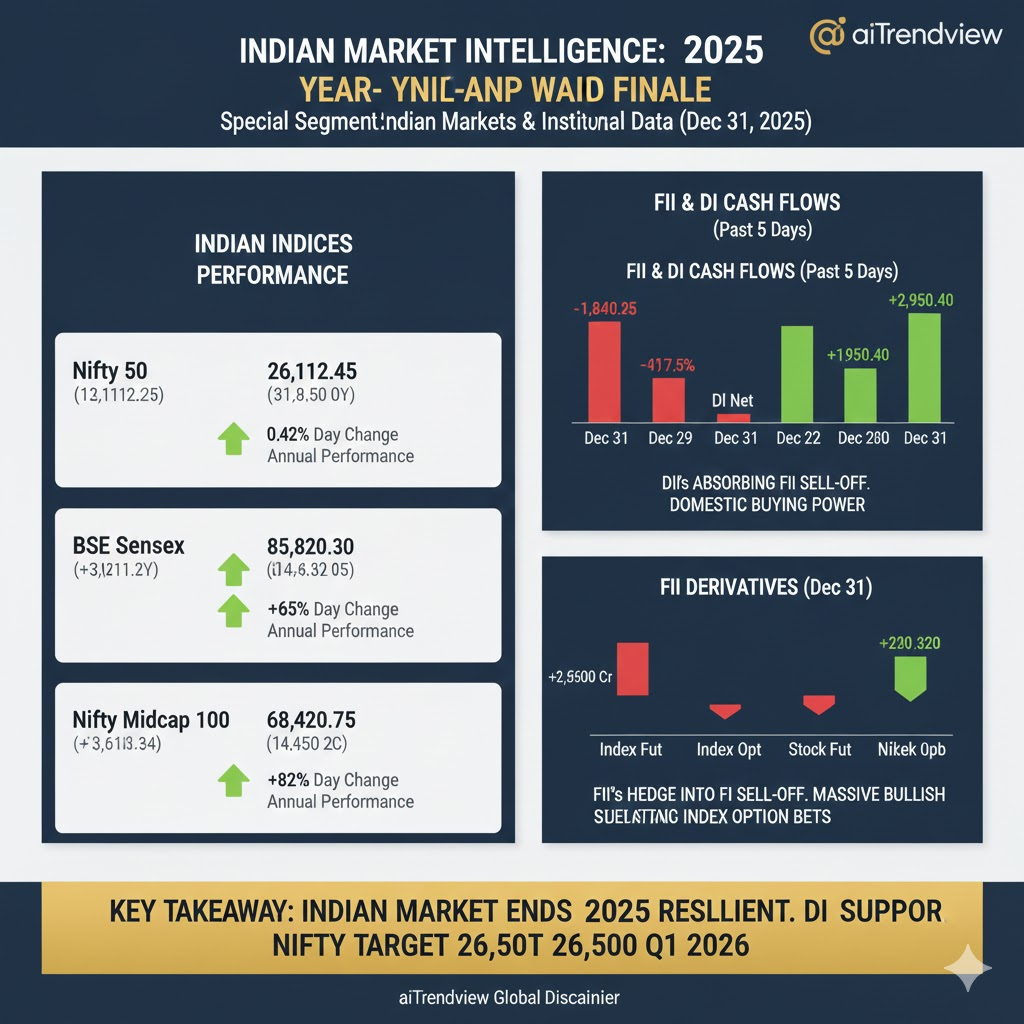
The Indian markets ended 2025 on a high note, successfully holding the 26,000 mark on the Nifty 50 despite significant year-end profit booking by FIIs.
| Index | Closing Value | Day Change | Annual Performance |
| Nifty 50 | 26,112.45 | +0.42% | +21.8% |
| BSE Sensex | 85,820.91 | +0.38% | +19.5% |
| Nifty Bank | 54,350.30 | +0.65% | +14.2% |
| Nifty Midcap 100 | 68,420.75 | +0.82% | +42.5% |
| Date | FII Cash Net | DII Cash Net | FII Index Options |
| Dec 31 | -1,840.20 | +2,950.40 | +12,450.30 |
| Dec 30 | -2,140.50 | +2,890.20 | -4,520.10 |
| Dec 29 | -2,759.89 | +2,643.85 | -1,986.40 |
| Dec 26 | -317.56 | +1,772.56 | +7,847.90 |
| Dec 24 | -1,721.30 | +2,381.30 | -1,606.90 |
| Asset | Live Price (USD) | 24h Change | Status |
| Bitcoin (BTC) | $88,412.50 | +0.62% | Consolidating |
| Ethereum (ETH) | $2,988.45 | +0.75% | Testing $3k |
| Solana (SOL) | $128.10 | +2.14% | Bullish |
| Asset | Live Price | Day Change | Status |
| Gold (Spot) | $4,522.40 | +0.18% | Safe Haven |
| Silver (Spot) | $71.95 | +0.42% | Supercycle |
| WTI Crude | $57.25 | +0.45% | Inventory Bid |
| DXY (Dollar Index) | 97.68 | -0.12% | Bearish |
| USD/INR | 89.42 | -0.08% | Rupee Strong |
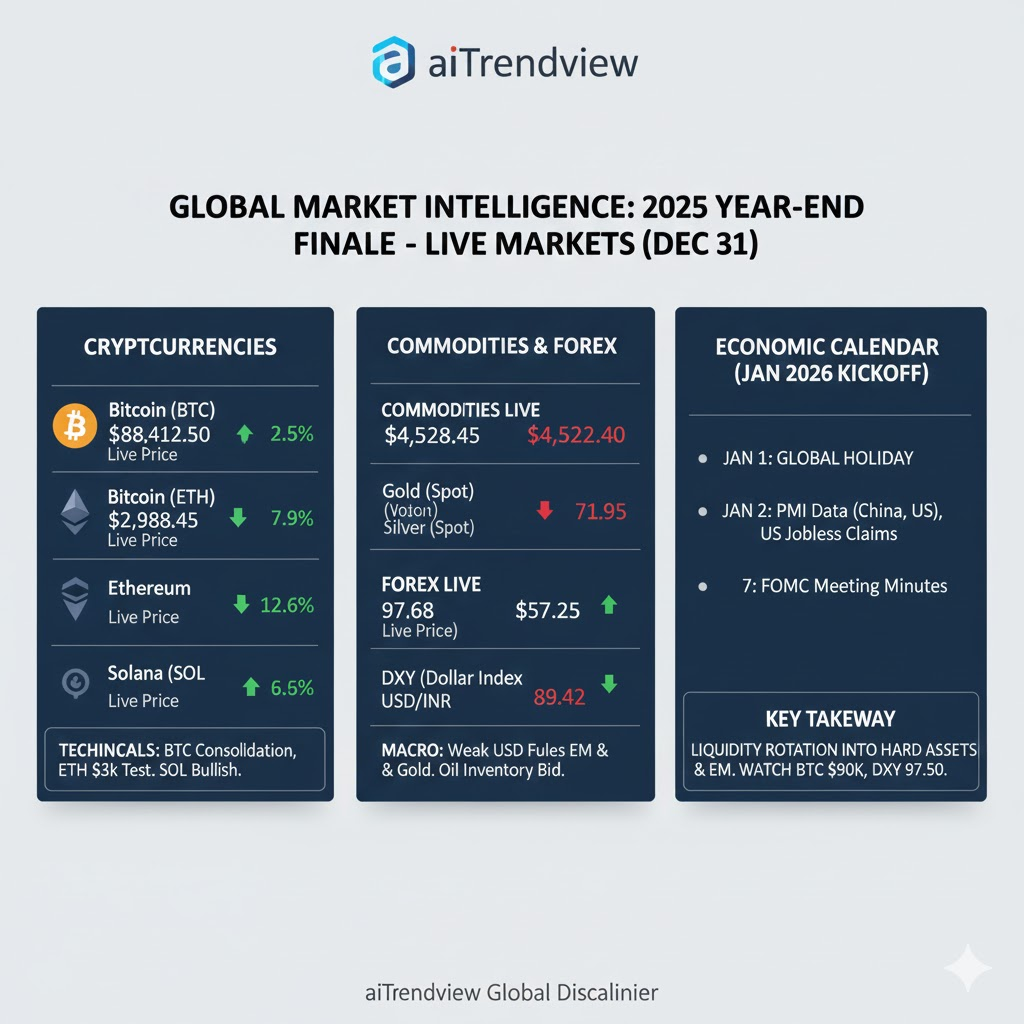
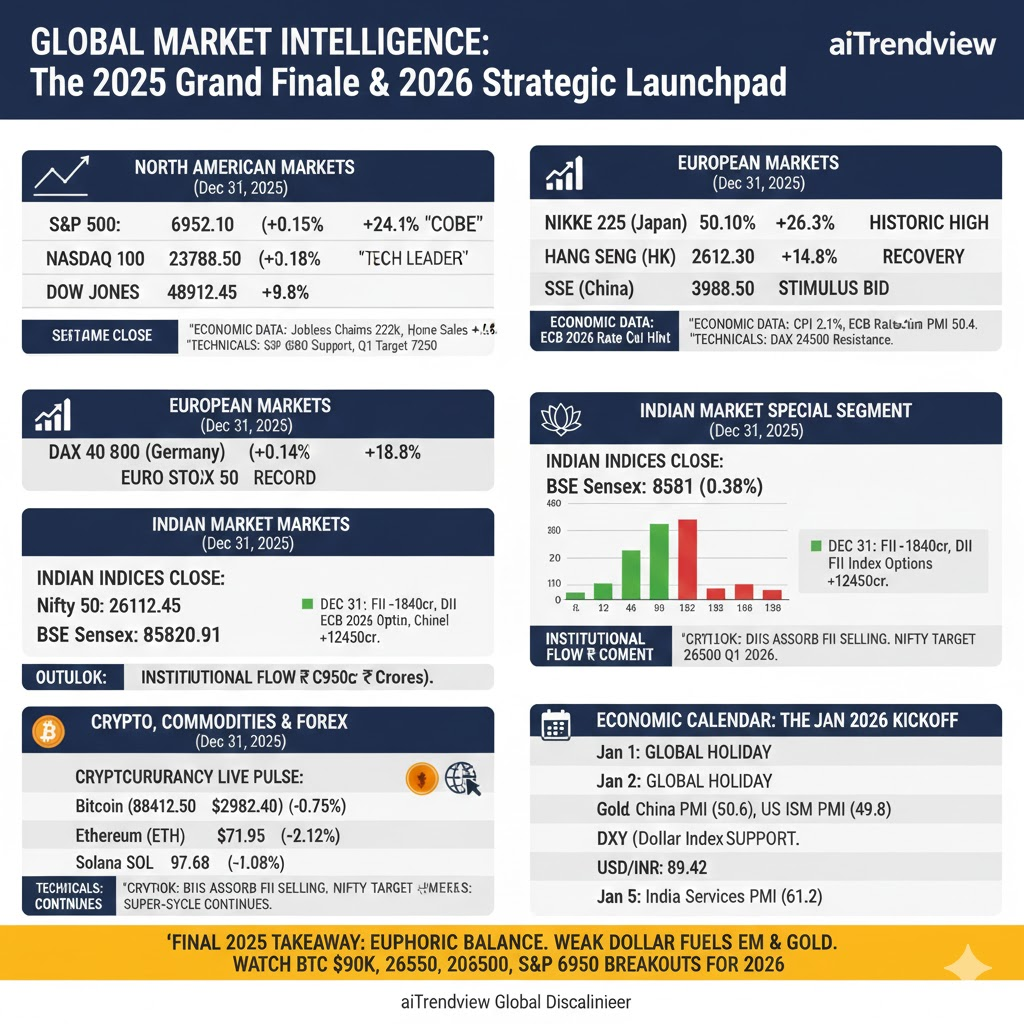
The markets close 2025 in a state of Euphoric Balance. The rotation out of the US Dollar into Emerging Markets and Hard Assets (Gold/Silver) is the dominant theme for the 2026 launchpad. Investors should watch the $90,000 BTC level and the 26,500 Nifty level as the primary targets for the first quarter of 2026.
This aiTrendview report is an AI-generated document provided exclusively for educational and training purposes and shall not be construed as investment, financial, legal, or tax advice in any jurisdiction.
aiTrendview and its affiliates are not SEBI-registered research analysts, investment advisers, or portfolio managers, and all information herein is automatically compiled from publicly available sources that may contain errors, delays, or omissions.
Users must independently verify all data before making any financial, commercial, or legal decisions, as no market values, performance figures, or trends contained in this report constitute guarantees or forward-looking statements.
Nothing in this publication should be interpreted as a solicitation, recommendation, or endorsement to buy, sell, or hold any security.
aiTrendview, its creators, and all associated AI systems disclaim all liability for losses or consequences arising from the use or reliance upon this content, and users accept full personal responsibility for all actions taken based on it.
Unauthorized reproduction, distribution, or modification of this AI-generated material is strictly prohibited under international copyright, compliance, and intellectual-property laws.