Many traders lose money not because their directional bias is wrong, but because their timing is off—entering too early or too late. In a recent tutorial on the TradingView YouTube channel, they break down the ABCD Harmonic Pattern, a structured approach that removes the guesswork from entries, defines risk, and sets precise profit targets.
Here is a summary of the pattern, how to measure it, and how to trade it.
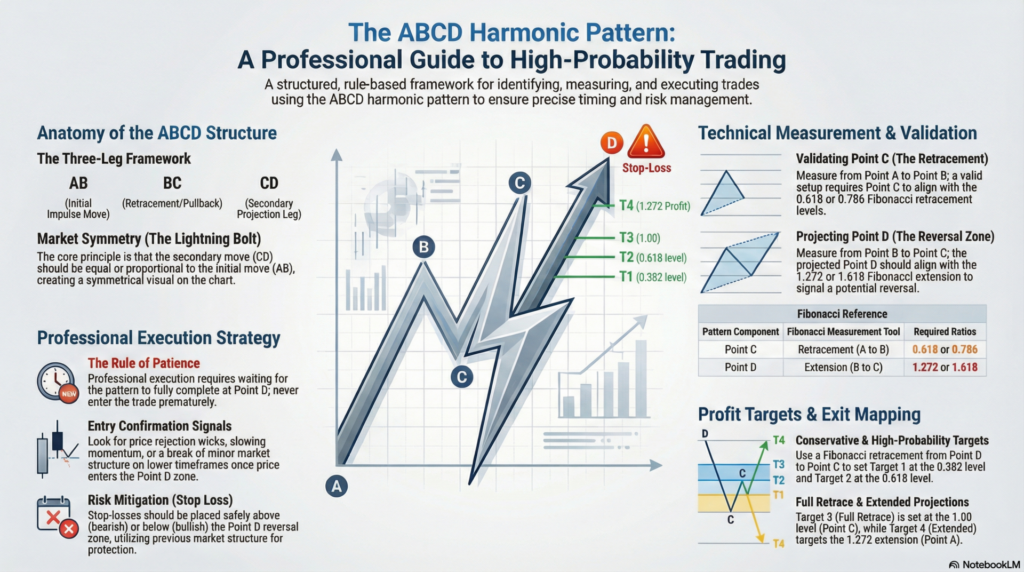
The ABCD pattern is a four-point harmonic structure that relies on market symmetry. It consists of three distinct legs:
The core idea is that the market makes a move, pulls back, and then makes a second move that is often equal (or proportional) to the first. When this second move completes at a specific Fibonacci ratio (Point D), traders look for a high-probability reversal.
To validate the pattern, you must use the Fibonacci Retracement and Extension tools:
Note: Ideally, the A-to-B leg and the C-to-D leg should look symmetrical, resembling a “lightning bolt” shape on your chart.
The most important rule of trading harmonics is patience: you never enter before the pattern completes.
Once you enter the trade at Point D, you use Fibonacci to map out conservative and extended take-profit zones. Pull a Fibonacci retracement from Point D to Point C:
By combining market symmetry with precise Fibonacci levels, the ABCD pattern provides a clear, rule-based framework that helps traders secure excellent risk-to-reward ratios. Mastering this foundational pattern is also the first step toward trading more complex harmonics like the Gartley, Bat, and Cypher patterns.
Legal Disclaimer & Liability Waiver
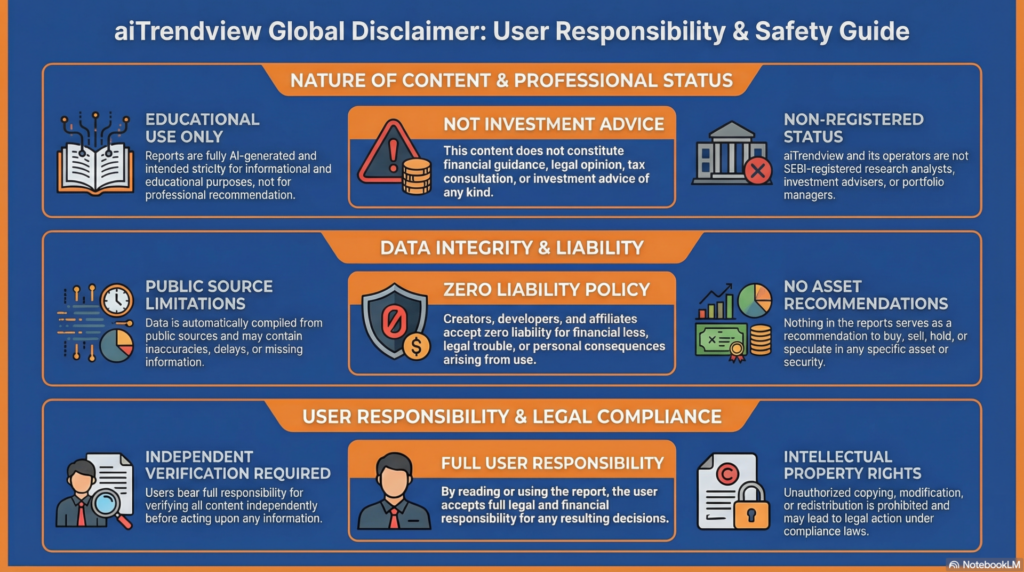
This AI-generated report is strictly educational and does not constitute financial, legal, or professional advice. aiTrendview and its affiliates are not SEBI-registered advisors and assume zero liability for any losses or consequences resulting from its use. All data is autonomously harvested from public sources and may be flawed, delayed, or incomplete; therefore, you assume exclusive responsibility for independently verifying information before taking any action. Under no circumstances should this content be construed as a recommendation to trade or speculate in any security. By accessing this material, you acknowledge that any reliance on this data is at your sole risk, and you agree to be bound by strict intellectual property protections prohibiting the unauthorized redistribution or modification of this work.