


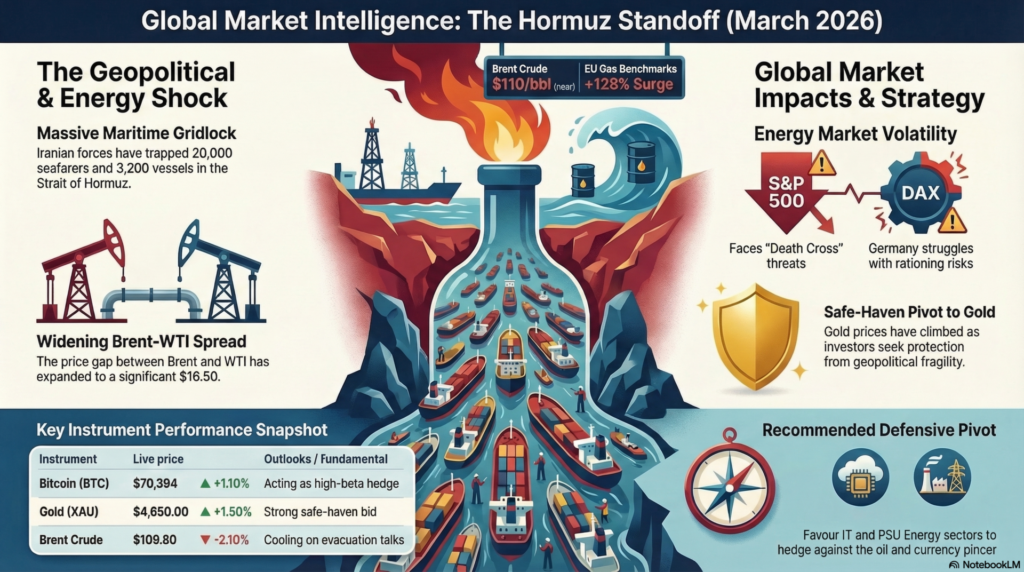
As of Friday, March 20, 2026, the global financial landscape is defined by “Black Swan” geopolitical fragility and a high-stakes institutional tug-of-war. The effective closure of the Strait of Hormuz by Iranian forces has trapped nearly 20,000 seafarers and 3,200 vessels, sending Brent crude volatility into overdrive near $110/bbl. While the UN’s International Maritime Organization (IMO) has called for an urgent “safe maritime framework,” markets are currently witnessing a tactical “relief rally” as traders bet on a quick diplomatic resolution or a U.S.-led evacuation mission. In India, the Nifty 50 has reclaimed the 23,000 level, bolstered by selective domestic buying, even as the broader macro environment remains stagflationary due to the relentless energy pincer and a hawkish Fed Chair Jerome Powell.
The S&P 500 enters the weekend testing a critical recovery pivot, currently oscillating near 6,680 after a volatile week that saw it surrender nearly 1.5% in a single session following Powell’s hawkish post-FOMC remarks. Technically, the index is attempting to reclaim its 50-day moving average, but the “Death Cross” on shorter timeframes remains a persistent threat as long as oil remains above the $100 threshold. Fundamentally, the index is being crushed by the dual pressure of sticky core inflation—accelerated by the $16.50 Brent-WTI spread—and a labor market that is finally showing signs of a “cooling” phase with unemployment hitting 4.4%. Support is firmly stationed at 6,550, which acted as a bounce-point during the mid-week “Black Wednesday” sell-off. Resistance is capped at 6,850, a level where institutional selling has historically intensified over the last quarter. Investors are closely watching the NY Empire State Manufacturing Index and preliminary PMI data to gauge if the industrial sector can withstand the energy shock. Sentiment is currently “Neutral-Bearish,” with professional traders favoring high-cash ratios to navigate the binary outcome of the Gulf conflict. A sustained breach of 6,600 would likely trigger a systematic liquidation toward the 6,400 floor. For now, the focus remains on whether the Trump administration will waive the Jones Act further to mitigate domestic fuel price spikes.
Europe’s DAX is exhibiting “Fragile Resilience,” struggling to maintain its footing above 23,500 as the Eurozone faces its most severe energy-driven structural crisis since 2022. Fundamentally, the index is the primary victim of the Qatar LNG (Ras Laffan) facility damage, which has sent EU gas benchmarks surging by 128% month-to-date. Technically, the DAX is tracing a “Bearish Flag” on the daily chart, with a cluster of resistance at 24,100 capping any significant upside momentum for the March expiry. Support is firmly stationed at 23,200, a level that has provided a liquidity floor during three separate tests of the “Hormuz Crisis” this month. The ECB’s hawkish stance, necessitated by imported energy inflation, continues to pressure valuations in rate-sensitive sectors like Real Estate and Utilities. Sentiment is currently “Strong Bearish,” as the prospect of industrial energy rationing in a worst-case scenario continues to loom over German manufacturing. Traders are prioritizing defensive healthcare and telecommunications over the high-beta automotive cycle. Monday’s open will be a test of whether European sovereign wealth funds will intervene to provide a liquidity floor. For now, the outlook remains bleak unless a maritime corridor is established soon.
The Nikkei 225 was closed today for a public holiday, but its “shadow” futures indicate a “Relief Bounce” to 54,100 as it follows the late-week recovery in U.S. technology stocks. Fundamentally, the index remains fundamentally squeezed by Japan’s status as a net-oil importer, with the USD/JPY nearing the 160.00 intervention threshold. Technically, the index has a significant “Bearish Gap” at 54,500 that it must fill to signal a true trend reversal, while support at 52,800 remains the critical demand zone. The Bank of Japan is in a “Policy Deadlock,” unable to raise rates to support the Yen without further crashing a domestic economy already sensitive to the Hormuz shock. Sentiment is “Neutral-Bullish” for the short term, but remains hostage to the broader Dollar strength and oil price trajectory. Traders are currently rotating into large-cap banks, which stand to benefit from any eventual shift away from zero-rate policies in a high-inflation world. Monday’s session will be heavily influenced by the China Industrial Production data, which acts as a lead indicator for Japanese machinery.
The Abu Dhabi Securities Exchange (ADX) remained closed for Eid Al Fitr today, but its fundamental backdrop is one of “Extreme Geopolitical Divergence.” The index entered the holiday near 9,571, acting as a rare global “Antifragility Play” due to the energy super-cycle boosting local fiscal surpluses. Technically, the ADX is exhibiting a “Bullish Pennant” formation, with current resistance at 9,800 and support established at 9,450. Fundamentally, the banking and energy sectors—specifically ADNOC and First Abu Dhabi Bank—are outperforming as they benefit from the broader energy windfall. However, the physical proximity to the conflict remains a “Tail Risk,” as retaliatory maneuvers near urban areas have prompted a “Strategic Defensive” stance from local funds. Investors are favoring large-cap sovereign-backed firms over high-beta mid-caps until naval freedom is restored. Monday’s reopening will track the weekend’s naval developments; if transit remains blocked, the energy sector will likely lead the index higher.
| Instrument | Price (Live) | Day % | Support | Resistance | Tech/Fund Analysis |
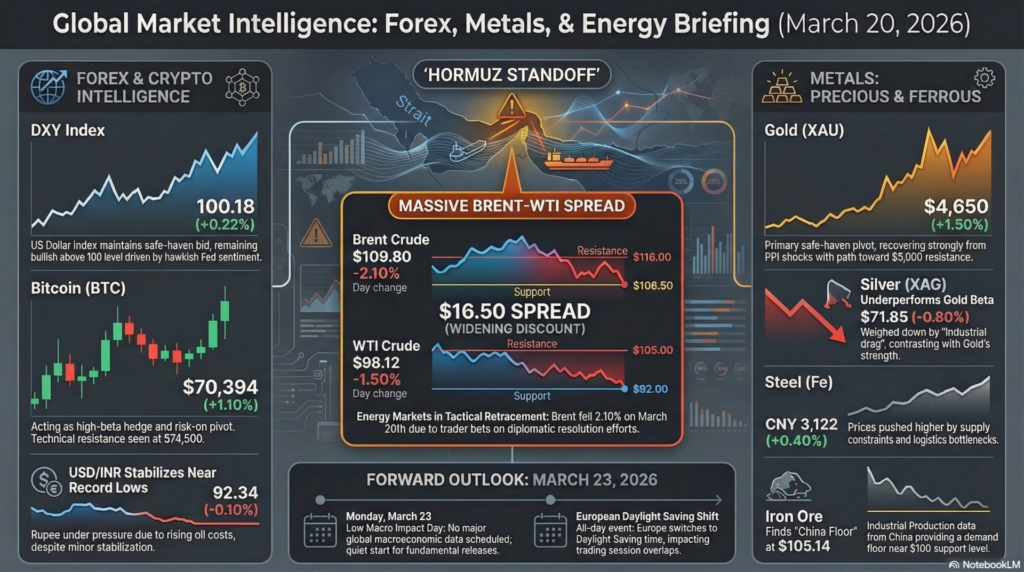
| DXY Index | 100.18 | +0.22% | 99.80 | 100.50 | Safe-Haven Bid. Bullish above 100 on hawkish Fed. |
| USD/INR | 92.34 | -0.10% | 91.80 | 93.50 | Oil Pressure. Stabilizing near record lows. |
| Bitcoin (BTC) | $70,394 | +1.10% | $68,600 | $74,500 | Risk-On Pivot. Acting as high-beta hedge. |
| Brent Crude | $109.80 | -2.10% | $106.50 | $116.00 | Retracing. Cooling on evacuation talks. |
| WTI Crude | $98.12 | -1.50% | $92.00 | $105.00 | Discount Widening. Brent-WTI spread at $16.50. |
| Commodity | Price | Day % | Support | Resistance | Technical Detail |
| Gold (XAU) | $4,650.00 | +1.50% | $4,550 | $5,000 | Safe-Haven Pivot. Recovering from PPI shock. |
| Silver (XAG) | $71.85 | -0.80% | $68.00 | $75.00 | Industrial Drag. Underperforming Gold beta. |
| Steel (Fe) | 3,122 CNY | +0.40% | 3,050 | 3,250 | Supply Constraint. Logistics bottlenecks. |
| Iron Ore | $105.14 | +0.40% | $100.00 | $112.00 | China Floor. IP data provides demand support. |
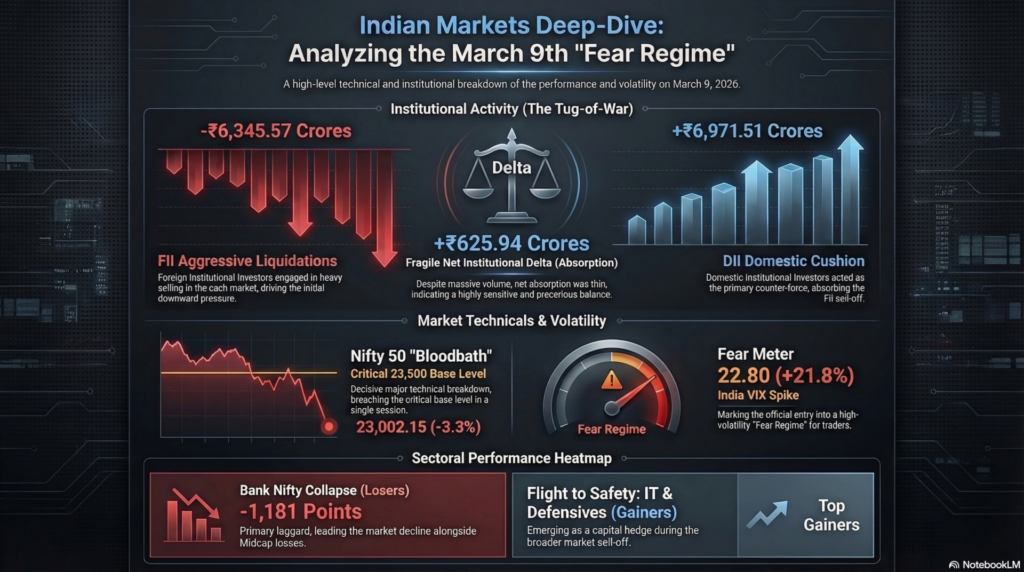
The user requested a deep-dive using March 9, 2026 data to compare against the current market structure.
| Time (IST) | Country | Event | Forecast | Previous | Impact |
| All Day | Global | Europe Switches to Daylight Saving | — | — | Low |
| N/A | Global | No Major Macro Data Scheduled | — | — | Low |
On Monday, March 16, 2026, the market behaved with “Bearish Decoupling.” While Asian peers saw a minor relief bounce due to a China Industrial Production beat (6.1%), the Indian Nifty fell -9.36% from the previous week’s highs as FIIs offloaded ₹9,365 Cr in a single day. The “War Premium” became a permanent fixture as Brent hit $116 for the first time.
The strategy for the weekend of March 20 is “Defensive Pivot.” * Next Step: Favour IT & PSU Energy (Praj Industries, Power Grid) as they hedge against the oil/INR pincer.
Legal Disclaimer & Liability Waiver – aiTrendview.com
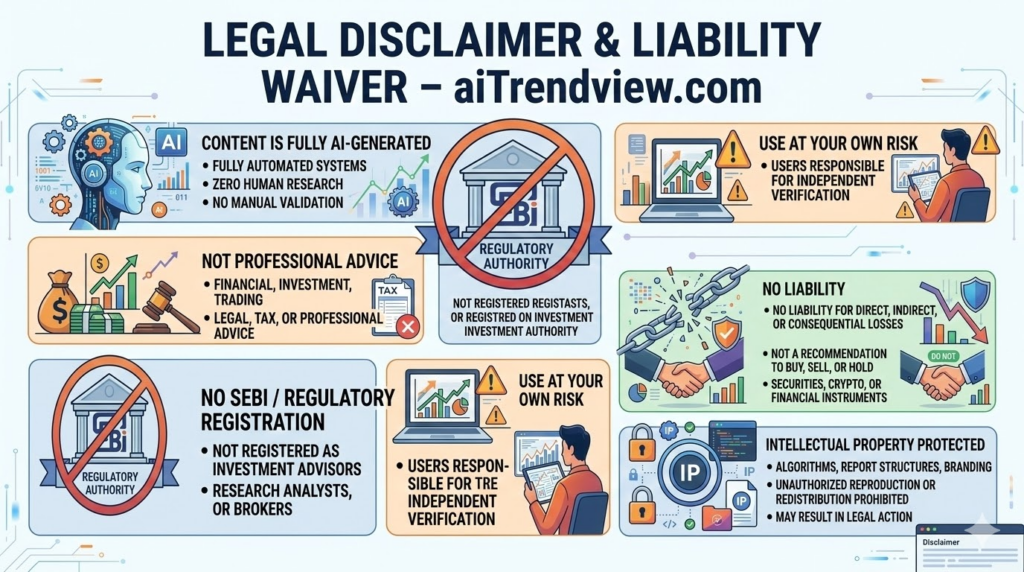
All content, reports, signals, analytics, forecasts, and materials published on aiTrendview.com are fully AI-generated outputs produced through automated systems with zero human research, manual validation, editorial review, or professional intervention. This platform does not provide financial, investment, trading, legal, tax, or professional advice of any kind. aiTrendview.com, its owners, affiliates, and associated entities are not registered with SEBI or any other regulatory authority as investment advisors, research analysts, brokers, or financial consultants. All data is autonomously aggregated from publicly available sources and algorithmic processes that may contain inaccuracies, delays, omissions, or technical errors. Users are solely and exclusively responsible for independently verifying all information before making any financial, legal, or commercial decisions.
By accessing or using this platform, you expressly acknowledge and agree that any reliance on the information provided is entirely at your own risk. aiTrendview.com assumes absolutely no liability for any direct, indirect, incidental, consequential, financial, legal, trading, or other losses arising from the use of, reliance upon, or inability to use any content or data published. Nothing on this platform shall be construed as a solicitation, endorsement, or recommendation to buy, sell, hold, or speculate in any security, derivative, commodity, cryptocurrency, or financial instrument. All intellectual property, including but not limited to algorithms, report structures, proprietary formats, branding, and system outputs, is strictly protected under applicable intellectual property laws. Unauthorized reproduction, redistribution, modification, or commercial exploitation is strictly prohibited and may result in civil and criminal legal action.