


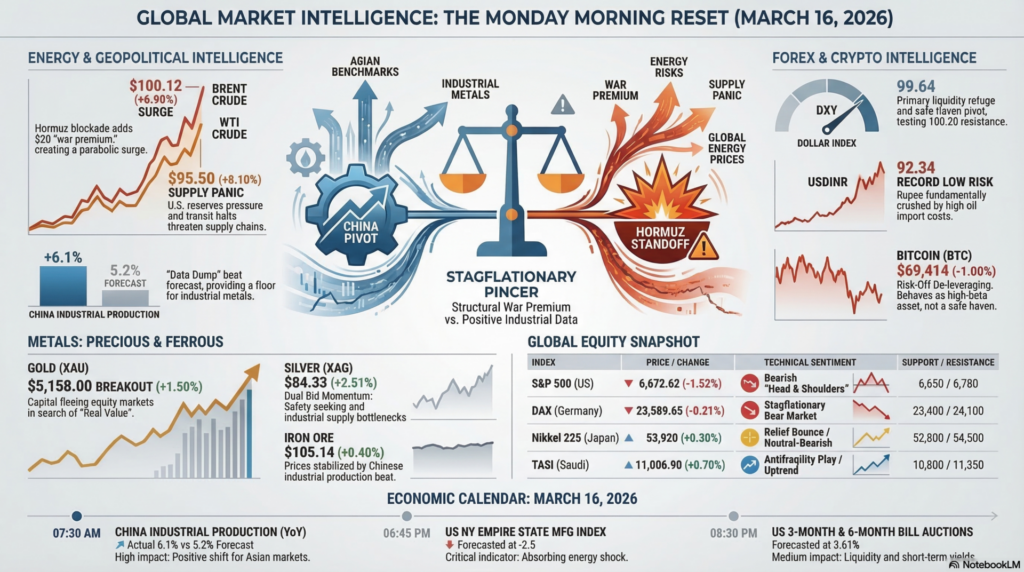
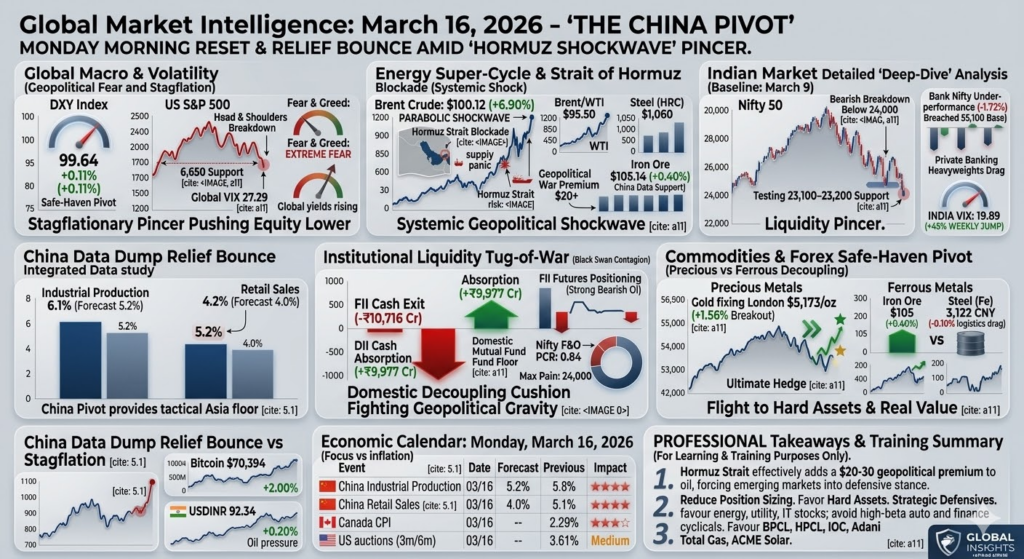
As of Monday morning, March 16, 2026, the global markets are navigating a high-stakes “Monday Morning Reset.” The primary focus has shifted from the weekend’s Hormuz Standoff to the high-impact China “Data Dump” released at 07:30 AM IST. While geopolitical tensions in the Gulf remain a structural “War Premium” in energy, the better-than-expected China Industrial Production (+6.1%) has provided a rare tailwind for Asian benchmarks, tempering the stagflationary fear that dominated the previous week. However, the sentiment remains fragile; the U.S. Dollar (DXY) continues to trade near the 100.00 psychological barrier as a safe-haven pivot, while the India VIX remains elevated at 21.05, indicating that domestic traders are not yet ready to abandon their defensive bunkers.
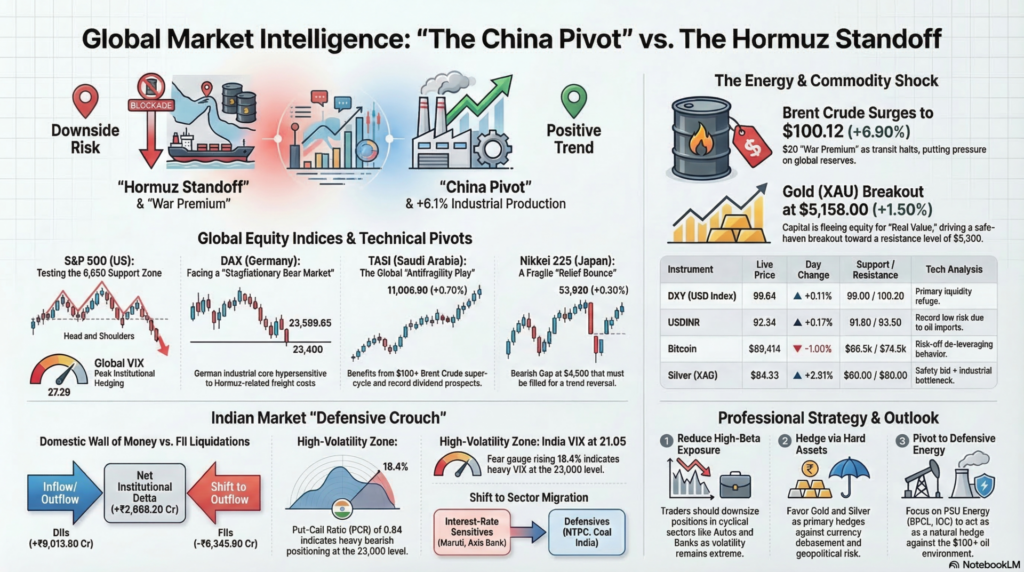
The S&P 500 enters the Monday session positioned at a critical technical pivot, currently testing the 6,650 support zone following a Friday close of 6,672.62 (-1.52%). Fundamentally, the index is reacting to the “Stagflationary Pincer,” where $100+ oil threatens to ignite a secondary wave of core inflation just as the Federal Reserve contemplates its next interest rate move. Technically, the index has formed a bearish “Head and Shoulders” pattern on the daily chart, with the Global VIX at 27.29 signaling that institutional hedging is at its highest level of the year. Resistance is firmly capped at 6,780, while the 200-day moving average near 6,550 represents the ultimate line of defense for the bulls. Investors are closely watching the NY Empire State Manufacturing Index (due today) to see if U.S. industry is effectively absorbing the energy shock. A breach of 6,600 would likely trigger a cascade of systematic selling toward the 6,400 psychological floor.
The DAX is the most vulnerable among Western benchmarks, currently struggling near 23,589.65 (-0.21%) as the European industrial core faces an energy-driven structural re-rating. Fundamentally, the German manufacturing sector is hypersensitive to the effective closure of the Strait of Hormuz, as skyrocketing freight and input costs threaten to erase Q1 profit margins for chemical and auto giants. Technically, the index is hovering dangerously close to its primary structural support at 23,400, with a weekly close below this mark likely to confirm a “Stagflationary Bear Market.” Support is stationed at 23,200, while resistance at 24,100 remains a formidable barrier for any upward momentum. The ECB is currently trapped in a “Policy Deadlock,” unable to signal rate cuts while energy-driven inflation risks de-anchoring.
Japan’s Nikkei 225 has opened the week with a “Relief Bounce” to 53,920 (+0.30%), momentarily snapping its downward slide as it digests the positive industrial data from China. However, the index remains fundamentally squeezed by Japan’s status as a net-oil importer, with the Yen’s volatility against the Dollar creating a “Currency Pincer” for domestic exporters. Technically, the index has a significant “Bearish Gap” at 54,500 that must be filled to signal a true trend reversal, while support at 52,800 remains the critical demand zone. The Bank of Japan is in a “Policy Trap,” unable to support the Yen without further pressuring an equity market already reeling from the Hormuz shock. Sentiment is “Neutral-Bearish,” with professional traders favoring yen-denominated safe-havens over high-beta consumer tech.
The Saudi Tadawul (TASI) continues to act as the global “Antifragility Play,” currently trading near 11,006.90 (+0.70%) as it benefits directly from the $100+ Brent Crude super-cycle. Fundamentally, the index is buoyed by massive fiscal surpluses and the prospect of Saudi Aramco delivering record Q1 dividends, providing a robust earnings cushion that offsets global growth jitters. Technically, the TASI is in a clear uptrend, trading well above its 50-day and 200-day moving averages with immediate support at 10,800. Resistance is projected at the multi-year high of 11,350, a level that may be tested if the Hormuz blockade persists throughout the week. While the physical proximity to the conflict remains a “Tail Risk,” the TASI is being used by global funds as a geographic hedge against European and Asian stagflation.
| Instrument | Live Price/Rate | Day Change (%) | Support | Resistance | Tech/Fund Analysis |
| DXY (USD Index) | 99.64 | +0.11% | 99.00 | 100.20 | Safe-Haven Pivot. Dollar remains the primary liquidity refuge. |
| USDINR | 92.34 | +0.17% | 91.80 | 93.50 | Record Low Risk. Fundamentally crushed by the $100 oil import bill. |
| Bitcoin (BTC) | $69,414 | -1.00% | $66,500 | $74,500 | Risk-Off De-leveraging. BTC is behaving as a high-beta asset. |
| Brent Crude | $100.12 | +6.90% | $95.00 | $115.00 | Parabolic Surge. Hormuz blockade adds a $20 war premium. |
| WTI Crude | $95.50 | +8.10% | $90.00 | $105.00 | Supply Panic. US reserves under pressure as transit halts. |
| Commodity | Price | Day Change (%) | Support | Resistance | Technical Detail |
| Gold (XAU) | $5,158.00 | +1.50% | $5,050 | $5,300 | Safe-Haven Breakout. Capital fleeing equity for “Real Value.” |
| Silver (XAG) | $84.33 | +2.51% | $80.00 | $90.00 | Dual Bid. Safety bid combined with industrial bottleneck. |
| Steel (Fe) | 3,122 CNY | -0.10% | 3,050 | 3,250 | Logistics Drag. Higher freight costs supported prices. |
| Iron Ore | $105.14 | +0.40% | $100.00 | $112.00 | China Data Support. Industrial Production beat provides a floor. |
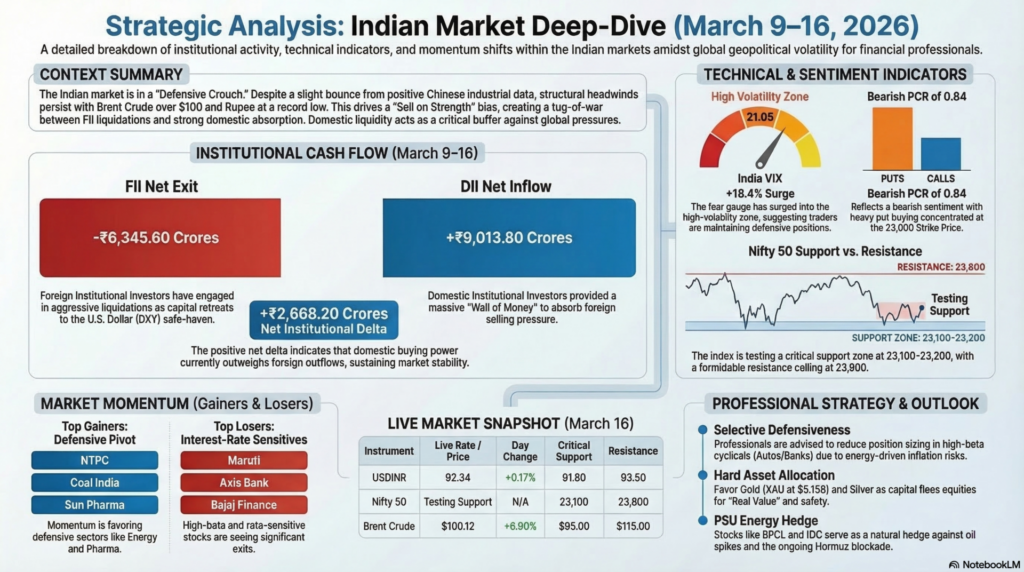
The Indian market is currently in a “Defensive Crouch.” While the China data has prevented a “Limit Down” open, the structural headwinds of $100 Oil and 92.34 INR keep the bias “Sell on Strength.”
| Time (IST) | Country | Event | Actual | Forecast | Impact |
| 07:30 AM | China | Industrial Production (YoY) | 6.1% | 5.2% | High (Positive) |
| 07:30 AM | China | Retail Sales (YoY) | 4.2% | 4.0% | Medium |
| 06:45 PM | US | NY Empire State Mfg Index | — | -2.5 | High |
| 08:30 PM | US | 3-Month & 6-Month Bill Auctions | — | 3.61% | Medium |
For Monday’s session, the strategy is “Selective Defensiveness.” The China Industrial Production beat provides a temporary floor for Asian metals and machinery stocks, but the Hormuz Blockade remains a binary “War Risk” that can override fundamentals in minutes.
Legal Disclaimer & Liability Waiver – aiTrendview.com
All content, reports, signals, analytics, forecasts, and materials published on aiTrendview.com are fully AI-generated outputs produced through automated systems with zero human research, manual validation, editorial review, or professional intervention. This platform does not provide financial, investment, trading, legal, tax, or professional advice of any kind. aiTrendview.com, its owners, affiliates, and associated entities are not registered with SEBI or any other regulatory authority as investment advisors, research analysts, brokers, or financial consultants. All data is autonomously aggregated from publicly available sources and algorithmic processes that may contain inaccuracies, delays, omissions, or technical errors. Users are solely and exclusively responsible for independently verifying all information before making any financial, legal, or commercial decisions.
By accessing or using this platform, you expressly acknowledge and agree that any reliance on the information provided is entirely at your own risk. aiTrendview.com assumes absolutely no liability for any direct, indirect, incidental, consequential, financial, legal, trading, or other losses arising from the use of, reliance upon, or inability to use any content or data published. Nothing on this platform shall be construed as a solicitation, endorsement, or recommendation to buy, sell, hold, or speculate in any security, derivative, commodity, cryptocurrency, or financial instrument. All intellectual property, including but not limited to algorithms, report structures, proprietary formats, branding, and system outputs, is strictly protected under applicable intellectual property laws. Unauthorized reproduction, redistribution, modification, or commercial exploitation is strictly prohibited and may result in civil and criminal legal action.


