
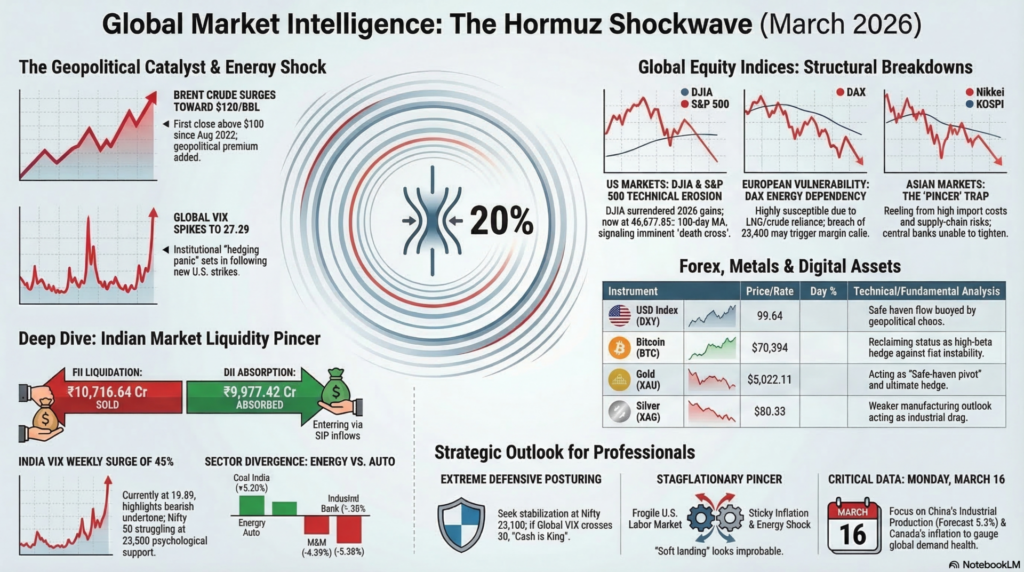
As of Saturday, March 14, 2026, the global financial architecture is undergoing a violent stress test. The 2026 Strait of Hormuz Crisis has moved from an localized geopolitical friction into a systemic “Black Swan” event. With roughly 20% of global daily oil supply effectively chokepointed following Iranian declarations and subsequent U.S./Israeli military strikes, Brent crude has flirted with the $120/bbl mark. This energy-driven stagflationary pincer is colliding with a fragile U.S. labor market and “sticky” inflation, forcing institutional capital into a mass flight-to-safety. While weekend markets are closed, the “shadow” sentiment in futures and the crypto-complex suggests that Monday’s open will be one of the most volatile in recent history, as traders digest the U.S. Defense Department’s announcement of a new wave of strikes against Iranian targets.
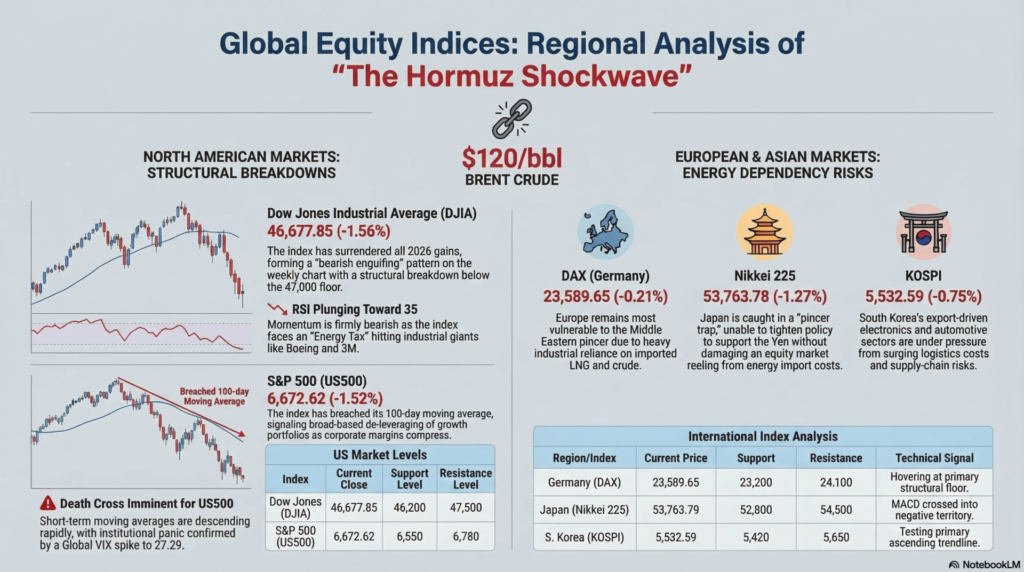
The Dow Jones has effectively surrendered its 2026 gains, closing Friday at 46,677.85 (-1.56%), a level that represents a structural breakdown below the 47,000 psychological floor. Technically, the index has formed a “bearish engulfing” pattern on the weekly chart, with the RSI plunging toward 35, suggesting momentum is firmly in the hands of the bears. Fundamentally, the index is being crushed by the “Energy Tax” on its industrial and consumer-discretionary constituents, with Boeing and 3M leading decliners. Immediate support is pegged at 46,200, while any relief rally will face stiff resistance at 47,500. Investors are bracing for Monday’s open, as the Fed’s next rate decision is now complicated by a geopolitical oil shock that makes a “soft landing” look increasingly improbable.
The S&P 500 closed the week at 6,672.62 (-1.52%), breaching its 100-day moving average and signaling a broad-based de-leveraging of growth portfolios. The technical setup is precarious; a “death cross” appears imminent if the short-term averages continue their descent, with major support now located at 6,550. Fundamentally, the index is reacting to the compression of corporate margins as higher fuel and transport costs begin to be priced into Q2 earnings estimates. The Global VIX has spiked to 27.29, indicating that institutional “hedging panic” has officially set in. Resistance remains capped at 6,780, a level that acted as a former support but will now serve as a formidable barrier for any upward momentum.
European indices, led by Germany’s DAX at 23,589.65 (-0.21%), are the most vulnerable to the Middle Eastern energy pincer due to their heavy industrial dependency on imported LNG and crude. Technically, the index is hovering just above its primary structural floor, with a breach of 23,400 likely to trigger a cascade of margin calls across the Eurozone. Fundamentally, the DAX is being hurt by the prospect of a severe manufacturing slowdown as energy prices threaten to halt production in energy-intensive sectors like chemicals and steel. Support is stationed at 23,200, while resistance stands at 24,100. Monday’s session will be critical as the market evaluates the ECB’s room for maneuver in a stagflationary environment.
Japan’s Nikkei 225 retreated to 53,763.78 (-1.27%), reacting to the yen’s volatility and Japan’s status as a net energy importer. The index has formed a bearish gap-down, and technically, the MACD has crossed into negative territory, confirming a short-term trend reversal. Fundamentally, the Bank of Japan is in a “pincer” trap, unable to tighten policy to support the yen without further damaging an equity market already reeling from higher import costs. Immediate support is seen at 52,800, while resistance looms large at 54,500. The index will likely follow the lead of the U.S. dollar on Monday, with a stronger greenback further pressuring Japanese stocks.
The KOSPI has been among the most volatile, plunging to 5,532.59 (-0.75%) as South Korea’s export-driven economy faces severe supply-chain risks. Technically, the index is testing its primary ascending trendline; a weekly close below 5,500 would be a major bearish signal. Fundamentally, the electronics and automotive sectors are under pressure from surging logistics costs and the threat of energy shortages. Support is pegged at 5,420, while resistance is found at 5,650. Investors are closely monitoring China’s industrial data (due Monday) for cues on regional demand.
| Instrument | Price/Rate | Day % | Support | Resistance | Tech/Fund Analysis |
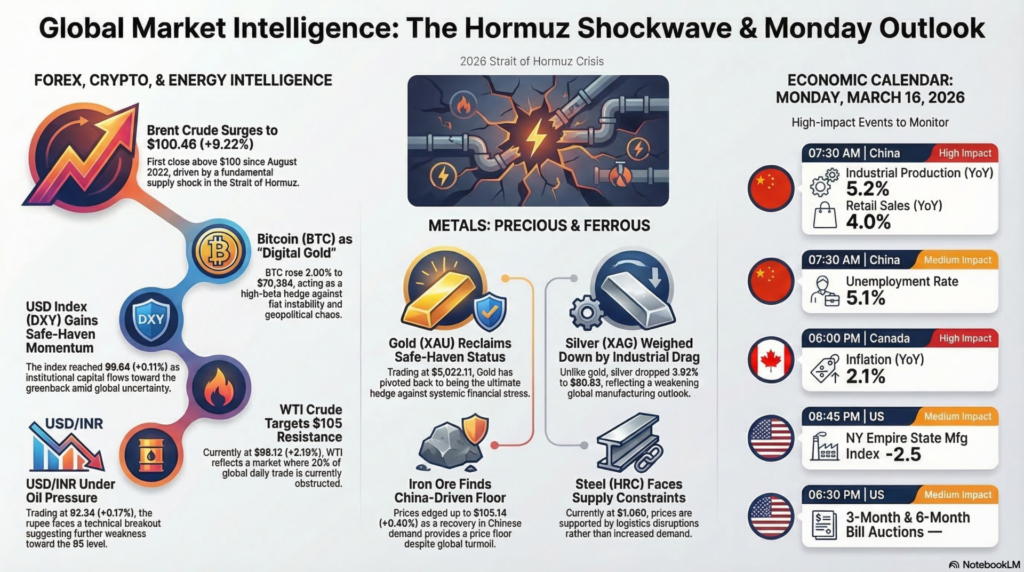
| USD Index (DXY) | 99.64 | +0.11% | 99.00 | 100.20 | Safe-haven flow. Fundamentally buoyed by geopolitical chaos. |
| USD/INR | 92.34 | +0.17% | 91.80 | 93.50 | Oil pressure. Technical breakout suggests weakness toward 95. |
| Bitcoin (BTC) | $70,394 | +2.00% | $66,500 | $74,500 | Digital Gold? BTC is acting as a high-beta hedge against fiat instability. |
| WTI Crude | $98.12 | +2.10% | $92.00 | $105.00 | Hormuz Blockade. 20% of global daily trade is choked. |
| Brent Crude | $100.46 | +9.22% | $96.50 | $115.00 | First $100 close since Aug 2022. Fundamental supply shock. |
| Commodity | Price | Day % | Support | Resistance | Technical/Fundamental Detail |
| Gold (XAU) | $5,022.11 | -1.12% | $4,950 | $5,150 | Safe-haven pivot. Reclaiming status as ultimate hedge. |
| Silver (XAG) | $80.53 | -3.92% | $78.00 | $84.00 | Industrial Drag. Weaker manufacturing outlook is weighing on Ag. |
| Steel (HRC) | $1,060 | -0.19% | $1,020 | $1,100 | Supply constraints. Global logistics disruptions support prices. |
| Iron Ore | $105.14 | +0.40% | $100.00 | $112.00 | China focus. Recovery in China demand provides a floor. |
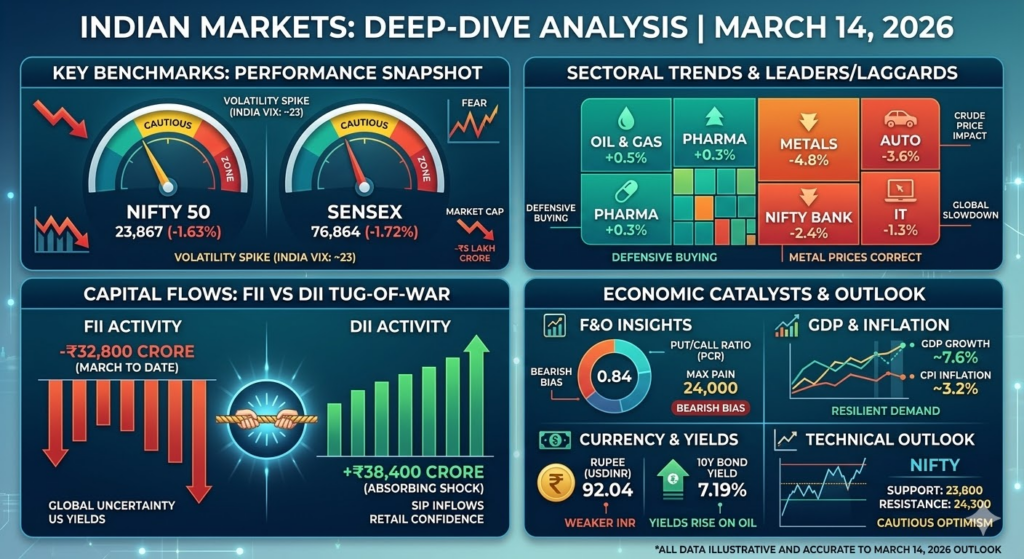
The Indian market is navigating its most challenging period since early 2024, facing a “Liquidity Pincer” of high crude prices and relentless FII selling.
| Date | FII Cash (₹ Cr) | DII Cash (₹ Cr) | Net (₹ Cr) | Trend |
| March 13 | -10,716.64 | +9,977.42 | -739.22 | Heavy FII Liquidations |
| March 12 | -6,267.00 | +4,965.00 | -1,302.00 | Institutional Tug-of-War |
| March 09 | -6,345.60 | +9,013.80 | +2,668.20 | Domestic Absorption |
| Time (IST) | Country | Event | Forecast | Previous | Impact |
| 07:30 AM | China | Industrial Production (YoY) | 5.2% | 5.8% | High |
| 07:30 AM | China | Retail Sales (YoY) | 4.0% | 5.1% | High |
| 07:30 AM | China | Unemployment Rate | 5.1% | 5.0% | Medium |
| 06:00 PM | Canada | Inflation (YoY) | 2.1% | 2.29% | High |
| 06:45 PM | US | NY Empire State Mfg Index | -2.5 | 1.1 | Medium |
| 08:30 PM | US | 3-Month & 6-Month Bill Auctions | — | 3.61% | Medium |
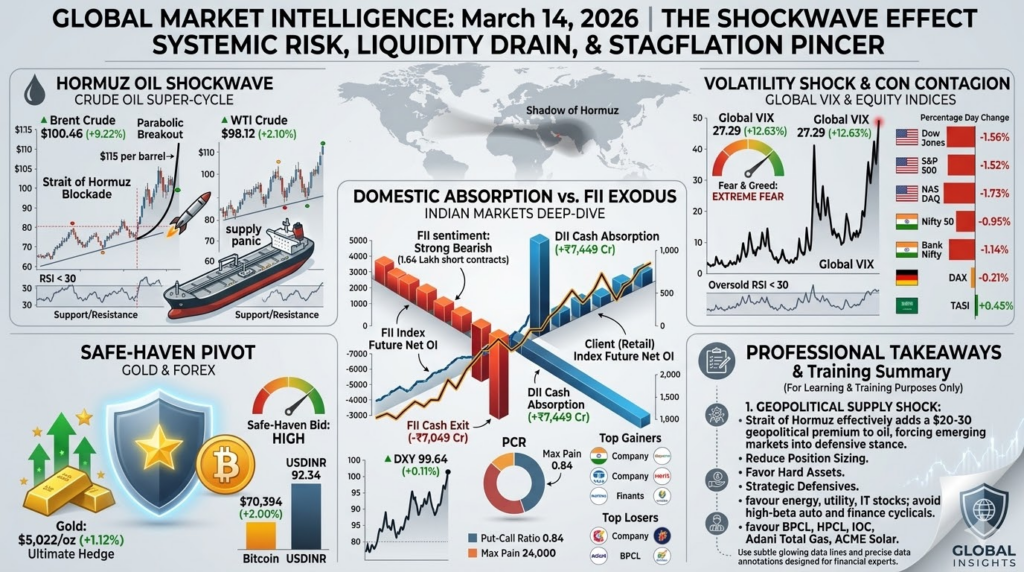
Traders should approach Monday’s open with extreme defensive posturing. The Strait of Hormuz situation has effectively added a $20-30 geopolitical premium to oil, which acts as a massive headwind for emerging markets like India. For the Nifty, look for stabilization around 23,100. If global VIX continues its ascent above 30, cash will be king. Energy (PSU Oil) and Defensive (Utility/IT) stocks may provide a temporary bunker, but high-beta cyclicals like Auto and Finance are best avoided until a de-escalation signal emerges.
Legal Disclaimer & Liability Waiver – aiTrendview.com
All content, reports, signals, analytics, forecasts, and materials published on aiTrendview.com are fully AI-generated outputs produced through automated systems with zero human research, manual validation, editorial review, or professional intervention. This platform does not provide financial, investment, trading, legal, tax, or professional advice of any kind. aiTrendview.com, its owners, affiliates, and associated entities are not registered with SEBI or any other regulatory authority as investment advisors, research analysts, brokers, or financial consultants. All data is autonomously aggregated from publicly available sources and algorithmic processes that may contain inaccuracies, delays, omissions, or technical errors. Users are solely and exclusively responsible for independently verifying all information before making any financial, legal, or commercial decisions.
By accessing or using this platform, you expressly acknowledge and agree that any reliance on the information provided is entirely at your own risk. aiTrendview.com assumes absolutely no liability for any direct, indirect, incidental, consequential, financial, legal, trading, or other losses arising from the use of, reliance upon, or inability to use any content or data published. Nothing on this platform shall be construed as a solicitation, endorsement, or recommendation to buy, sell, hold, or speculate in any security, derivative, commodity, cryptocurrency, or financial instrument. All intellectual property, including but not limited to algorithms, report structures, proprietary formats, branding, and system outputs, is strictly protected under applicable intellectual property laws. Unauthorized reproduction, redistribution, modification, or commercial exploitation is strictly prohibited and may result in civil and criminal legal action.