
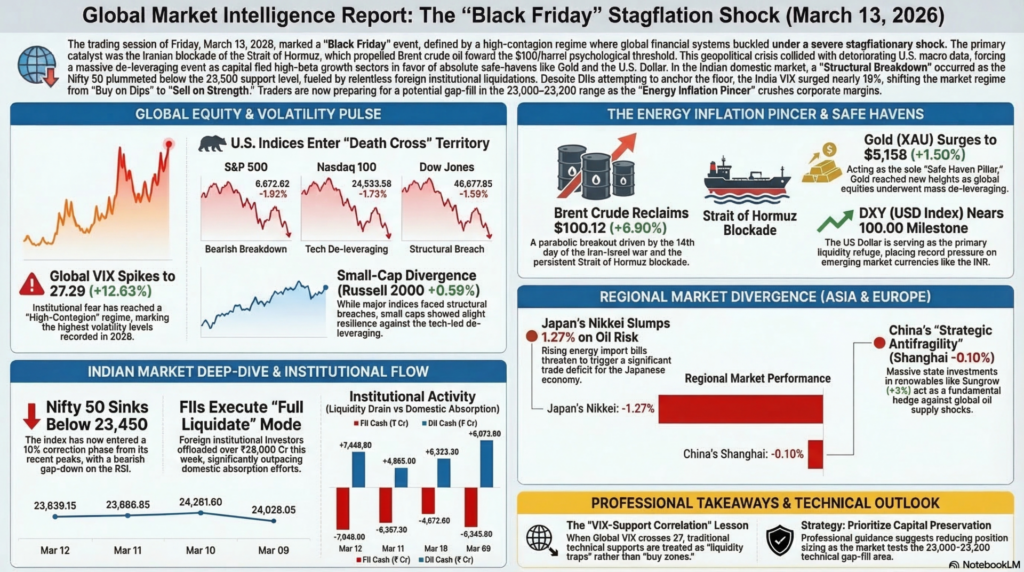
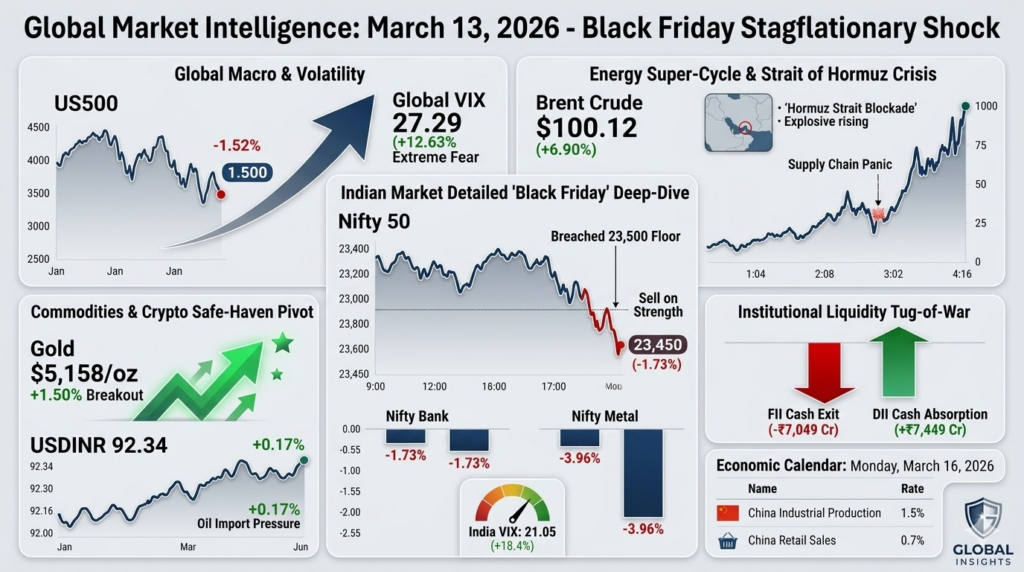
The trading session of Friday, March 13, 2026, has descended into a “Black Friday” panic as global financial systems buckle under the weight of a severe stagflationary shock. The defining catalyst is the catastrophic escalation in West Asia, where the effective closure of the Strait of Hormuz by Iranian forces has sent crude oil prices on a parabolic trajectory toward $100 per barrel. This energy crisis is colliding with deteriorating U.S. macro data, specifically a 1.73% weekly crash in the Nifty 50 and a 12.63% spike in the Global VIX to 27.29, signaling that institutional fear has reached a “High-Contagion” regime. Equity markets globally are experiencing mass de-leveraging as capital flees high-beta growth sectors in favor of absolute safe-havens like the U.S. Dollar and Gold.
In the Indian domestic market, the session is characterized by a “Structural Breakdown” as indices succumb to the double-whammy of skyrocketing import bills and relentless foreign liquidations. The Nifty 50 has plummeted below the crucial 23,500 support level, losing over 10% from its recent peaks. Institutional data highlights a relentless “Liquidity Drain,” with Foreign Institutional Investors (FIIs) executing a massive net sell of -₹7,049 Crores, while Domestic Institutional Investors (DIIs) struggle to anchor the floor with a +₹7,449 Crore absorption. With the India VIX surging nearly 18%, the market intent has shifted from “Buy on Dips” to “Sell on Strength,” as traders brace for a potential fill of the 23,000–23,200 technical gap.
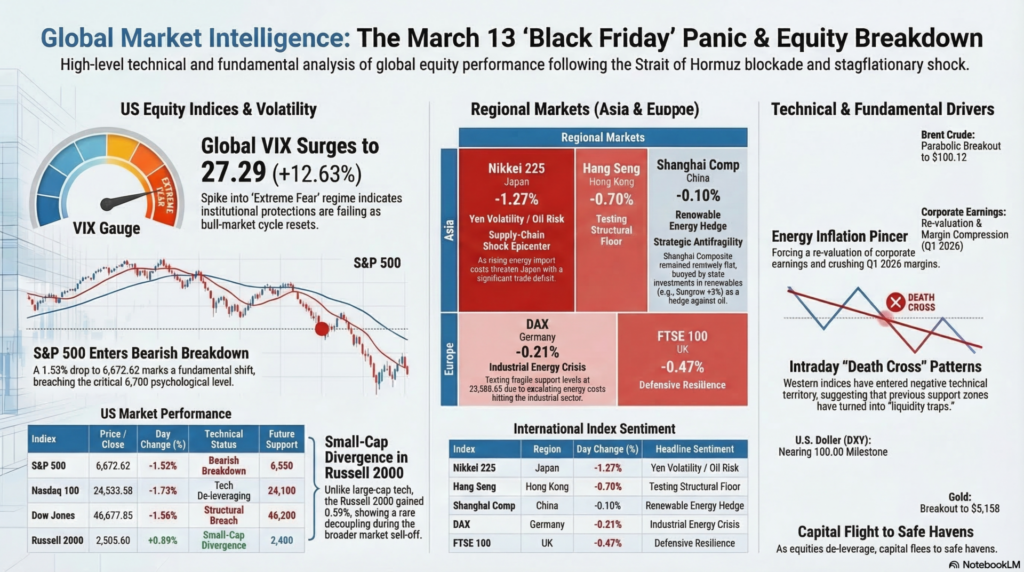
| Index | Price / Close | Day Change (%) | Technical Status | Future Support / Resistance |
| S&P 500 (US) | 6,672.62 | -1.52% | Bearish Breakdown | Support: 6,550 / Resistance: 6,780 |
| Nasdaq 100 | 24,533.58 | -1.73% | Tech De-leveraging | Support: 24,100 / Resistance: 25,000 |
| Dow Jones | 46,677.85 | -1.56% | Structural Breach | Support: 46,200 / Resistance: 47,500 |
| Russell 2000 | 2,505.60 | +0.59% | Small-Cap Divergence | Support: 2,480 / Resistance: 2,550 |
| Global VIX | 27.29 | +12.63% | Extreme Fear | Support: 24.00 / Resistance: 32.00 |
Technical Analysis: Western indices have entered a “Death Cross” territory on intraday charts, with the Global VIX spiking 12.63% to its highest level in 2026. The S&P 500’s breach of 6,700 marks a fundamental shift, indicating that the bull-market cycle is being reset by stagflationary pressures.
Fundamental Analysis: The primary driver is the “Energy Inflation Pincer.” Rising WTI and Brent prices are forcing a re-valuation of corporate earnings, as higher operating costs are expected to crush margins in the Q1 2026 reporting season.
| Index | Price / Close | Day Change (%) | Technical Movement | Headline Sentiment |
| Nikkei 225 | 53,763.78 | -1.27% | Bearish Gap | Yen Volatility/Oil Risk |
| Hang Seng | 25,716.76 | -0.70% | Testing Structural Floor | China Trade Jitters |
| Shanghai Comp | 4,129.10 | -0.10% | Narrow Consolidation | Renewable Energy Hedge |
| DAX (Germany) | 23,589.65 | -0.21% | Fragile Support | Industrial Energy Crisis |
| FTSE 100 | 10,305.15 | -0.47% | Commodity Stock Support | Defensive Resilience |
Research Report: Asia is the epicenter of the supply-chain shock; the Nikkei has slumped over 1.2% as Japan’s energy import bill threatens to trigger a trade deficit. Conversely, Chinese stocks like the Shanghai Composite (-0.1%) are showing “Strategic Antifragility,” supported by massive state investments in renewables (Sungrow +3%, Goldwind +2.3%) which are acting as a fundamental hedge against oil supply shocks.
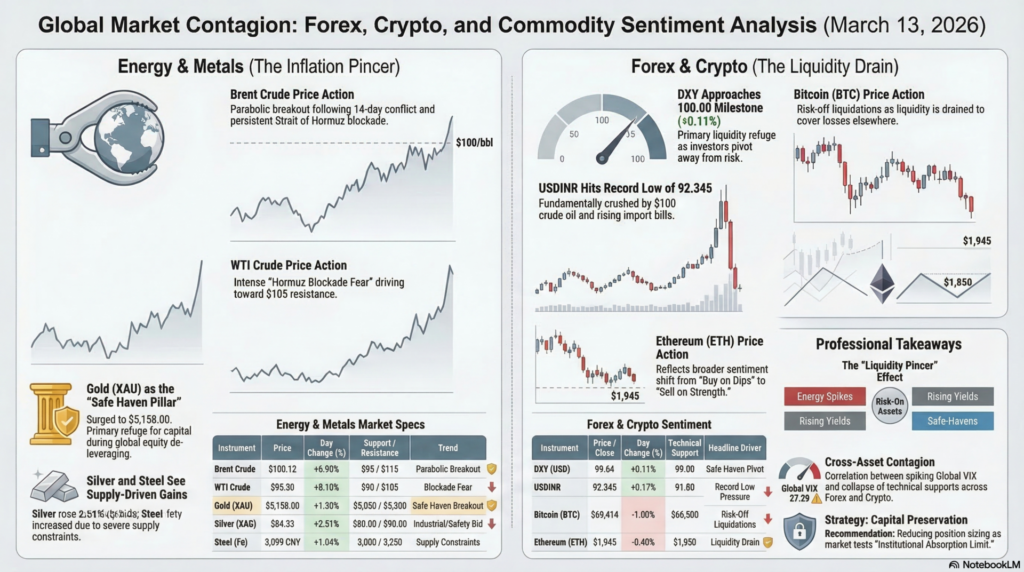
| Instrument | Price / Close | Day Change (%) | Technical Support | Headline Driver |
| DXY (USD) | 99.64 | +0.11% | 99.00 | Safe Haven Pivot |
| USDINR | 92.345 | +0.17% | 91.80 | Record Low Pressure |
| Bitcoin (BTC) | $69,414 | -1.00% | $66,500 | Risk-Off Liquidations |
| Ethereum (ETH) | $1,945 | -0.40% | $1,850 | Liquidity Drain |
Analysis: The U.S. Dollar (DXY) is nearing the 100.00 milestone as a primary liquidity refuge. The Indian Rupee (INR) has plummeted to a near all-time low of 92.34, fundamentally crushed by the $100 crude oil price point.
| Instrument | Price | Day Change (%) | Support / Resistance | Movement / Trend |
| Brent Crude | $100.12 | +6.90% | $95 / $115 | Parabolic Breakout |
| WTI Crude | $95.50 | +8.10% | $90 / $105 | Hormuz Blockade Fear |
| Gold (XAU) | $5,158.00 | +1.50% | $5,050 / $5,300 | Safe Haven Breakout |
| Silver (XAG) | $84.33 | +2.51% | $80.00 / $90.00 | Industrial/Safety Bid |
| Steel (Fe) | 3,099 CNY | +1.04% | 3,000 / 3,250 | Supply Constraints |
Analysis: Crude oil has officially reclaimed the $100 mark following the 14th day of the Iran-Israel war and the persistent blockade of the Strait of Hormuz. Gold is the sole “Safe Haven Pillar,” surging toward $5,200 as global equities de-leverage.
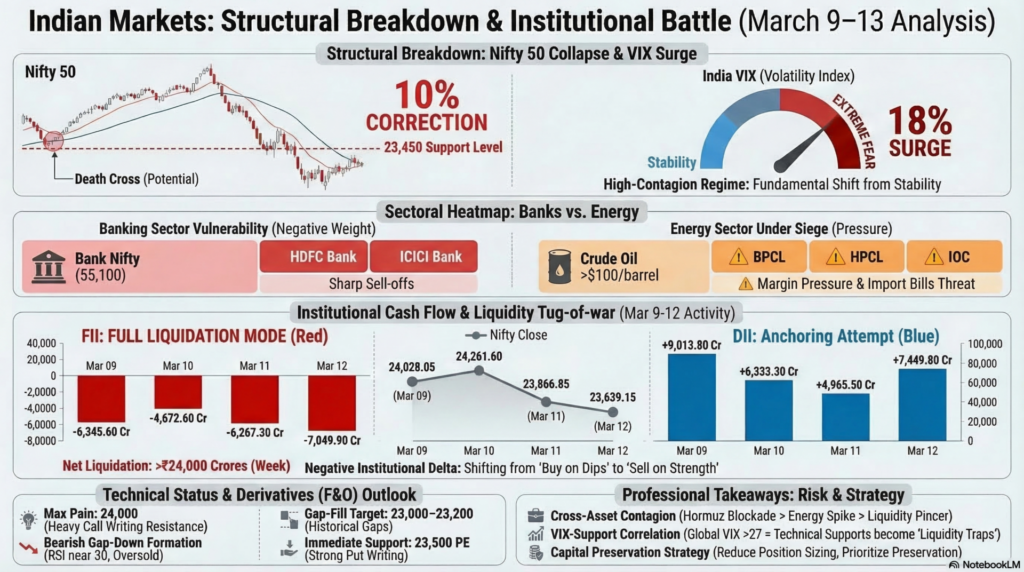
| Date | FII Cash (₹ Cr) | DII Cash (₹ Cr) | Nifty Close |
| Mar 12 | -7,049.90 | +7,449.80 | 23,639.15 |
| Mar 11 | -6,267.30 | +4,965.50 | 23,866.85 |
| Mar 10 | -4,672.60 | +6,333.30 | 24,261.60 |
| Mar 09 | -6,345.60 | +9,013.80 | 24,028.05 |
Institutional Strategy: FIIs are in “Full Liquidate” mode, offloading over ₹24,000 Cr this week alone. DIIs are attempting to absorb the shock, but the negative institutional delta is widening.
| Time (ET) | Event / Data Release | Forecast | Previous | Impact |
| 02:00 AM | China Industrial Production (YoY) | 6.0% | 5.8% | High |
| 02:00 AM | China Retail Sales (YoY) | 4.2% | 4.0% | High |
| 12:30 PM | Canada CPI (YoY) | 2.1% | 2.3% | Medium |
For educational purposes, the March 13 session is a masterclass in “Cross-Asset Contagion.” When a geopolitical event (Hormuz blockade) triggers an energy spike ($100 oil) during a period of rising global yields, the result is a “Liquidity Pincer” that drains capital from all risk-on assets. For a trainee trader, the key lesson is the VIX-Support Correlation; when the Global VIX crosses 27, traditional technical supports like the Nifty 24,000 level are treated as “liquidity traps” rather than “buy zones”.
Secondly, the “Institutional Absorption Limit” is being tested. While DIIs bought ₹7,449 Cr, the Nifty still fell 1%, indicating that domestic liquidity alone cannot fight a global “Risk-Off” tide. The strategy for Monday is to reduce position sizing and prioritize capital preservation, as the next major technical support for Nifty lies at the 23,000–23,200 gap-fill area.
Legal Disclaimer & Liability Waiver – aiTrendview.com

All content, reports, signals, analytics, forecasts, and materials published on aiTrendview.com are fully AI-generated outputs produced through automated systems with zero human research, manual validation, editorial review, or professional intervention. This platform does not provide financial, investment, trading, legal, tax, or professional advice of any kind. aiTrendview.com, its owners, affiliates, and associated entities are not registered with SEBI or any other regulatory authority as investment advisors, research analysts, brokers, or financial consultants. All data is autonomously aggregated from publicly available sources and algorithmic processes that may contain inaccuracies, delays, omissions, or technical errors. Users are solely and exclusively responsible for independently verifying all information before making any financial, legal, or commercial decisions.
By accessing or using this platform, you expressly acknowledge and agree that any reliance on the information provided is entirely at your own risk. aiTrendview.com assumes absolutely no liability for any direct, indirect, incidental, consequential, financial, legal, trading, or other losses arising from the use of, reliance upon, or inability to use any content or data published. Nothing on this platform shall be construed as a solicitation, endorsement, or recommendation to buy, sell, hold, or speculate in any security, derivative, commodity, cryptocurrency, or financial instrument. All intellectual property, including but not limited to algorithms, report structures, proprietary formats, branding, and system outputs, is strictly protected under applicable intellectual property laws. Unauthorized reproduction, redistribution, modification, or commercial exploitation is strictly prohibited and may result in civil and criminal legal action.