

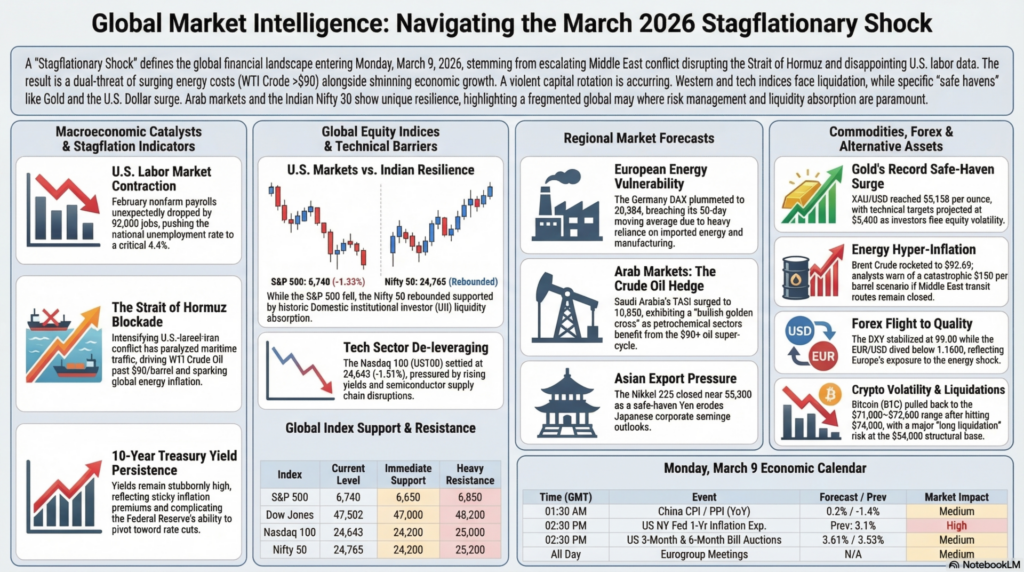
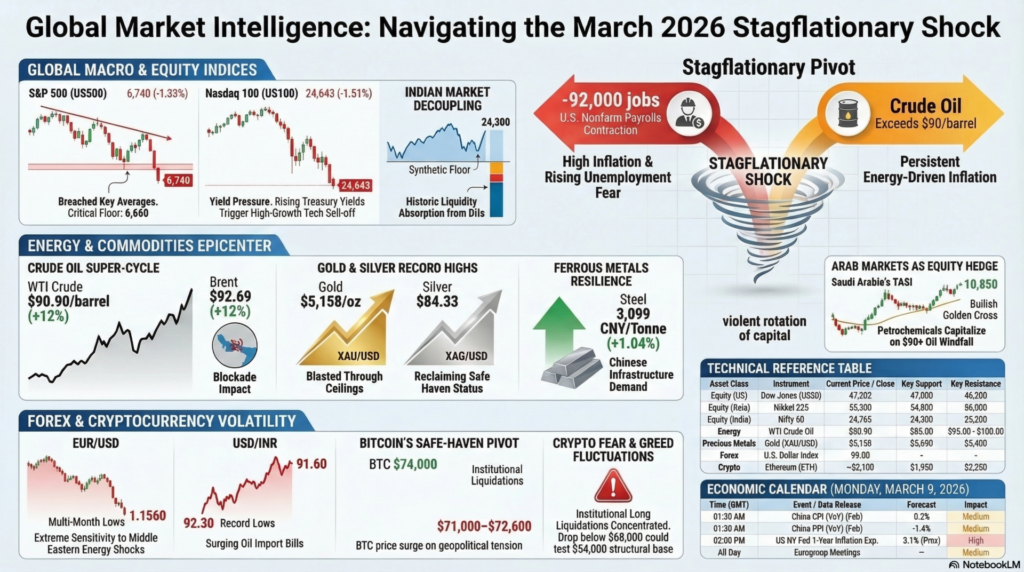
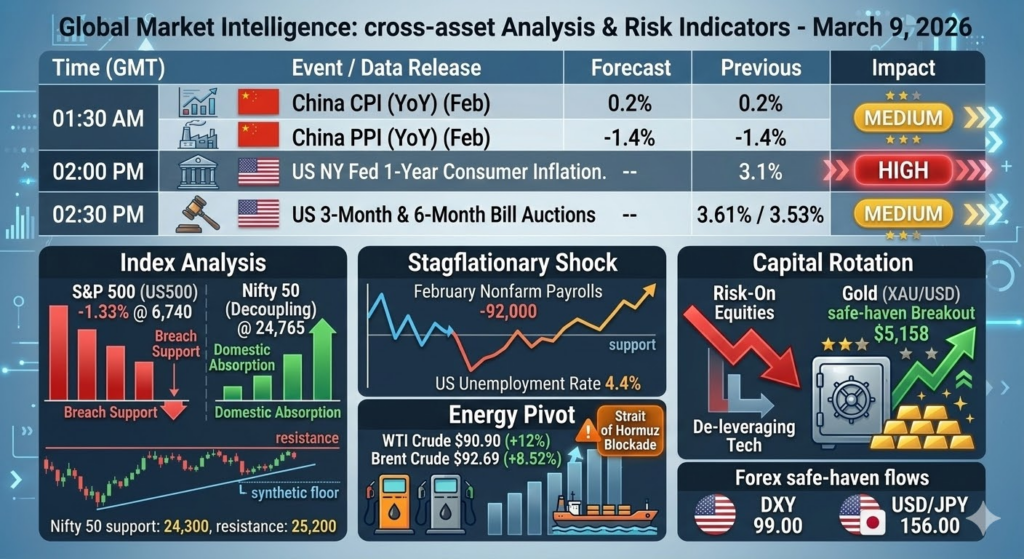
As we step into the trading week starting Monday, March 9, 2026, the global financial landscape is firmly gripped by severe geopolitical anxieties and macroeconomic distress. The escalating conflict in the Middle East, specifically the intensifying U.S.-Israel-Iran war, has sent shockwaves through energy markets, drastically disrupting maritime traffic in the Strait of Hormuz. This geopolitical crisis coincided with a massive disappointment in the U.S. labor market, where February nonfarm payrolls unexpectedly contracted by 92,000 jobs, pushing the unemployment rate up to 4.4% and increasing wage inflation. The convergence of surging energy prices—with crude oil breaking past $90 a barrel—and shrinking employment has reignited fears of profound stagflation. Market participants are increasingly defensive, as the potential for extended supply-chain paralysis threatens to keep inflation stubbornly high, complicating the Federal Reserve’s interest rate trajectory. Equity markets faced heavy sell-offs, and volatility metrics remain highly elevated, marking a definitive end to the complacency that characterized earlier quarters.
This stagflationary shock has triggered a violent capital rotation out of risk-on, high-beta assets and into traditional safe havens. Wall Street indices closed out their worst week in months, with the Dow Jones shedding over 400 points to break below 48,000, while the S&P 500 and Nasdaq experienced persistent downward pressure. Conversely, the Indian markets showcased a fascinating decoupling dynamic; despite persistent Foreign Institutional Investors (FIIs) offloading, Domestic Institutional Investors (DIIs) stepped in with historic liquidity absorption, creating a synthetic floor for the Nifty 50. Heading into Monday’s open, institutional delta positioning remains heavily skewed toward capital preservation. Traders will be hyper-focused on the bond market, where the U.S. 10-year Treasury yield is hovering stubbornly high, reflecting sticky inflation premiums. The overarching sentiment is one of extreme caution, with asset managers deploying aggressive hedging strategies through index puts and retreating to the safety of precious metals and the U.S. dollar amid global fragmentation.
Global Indices
The global equity landscape exhibits deep fragmentation, with U.S. markets reeling from stagflation fears and Asian markets displaying mixed resilience. The S&P 500 (US500) closed sharply lower at 6,740 (-1.33%), breaching its immediate moving averages, with key support now resting at 6,650 and heavy resistance at 6,850. The Dow Jones (US30) plummeted to 47,502, breaking the psychological 48,000 floor; further downside support is pegged at 47,000 with resistance near 48,200. The tech-heavy Nasdaq 100 (US100) settled at 24,643 (-1.51%), hurt by rising yield expectations, with critical support at 24,200 and resistance at 25,000. In India, the Nifty 50 demonstrated surprising strength due to domestic absorption, rebounding to close near 24,765; its immediate support is defended fiercely at 24,300 (August 2025 lows), while resistance looms large at 25,200. Fundamentally, indices are priced for a slowdown, and tomorrow’s session will likely see gap-down pressures on Western indices filtering into Asia, demanding strict risk management from traders.
Asian Market Indices
Asian market indices are bracing for a turbulent Monday open, acting as the first responders to the weekend’s geopolitical shockwaves and the U.S. stagflation data. The Nikkei 225, heavily reliant on export stability, closed defensively near 55,300, with technical indicators flashing oversold conditions; its immediate support lies at 54,800, while any relief rally will face stiff resistance at 56,000 . Fundamentally, a strengthening yen acting as a safe haven is eroding Japanese corporate earnings outlooks. Meanwhile, the Hang Seng Index sits precariously at 25,630, weighed down by localized economic sluggishness and global demand fears, testing a critical structural support base at 25,200 with overhead resistance capped at 26,000. South Korea’s KOSPI is highly exposed to semiconductor supply chain disruptions, retreating to 4,214, where it confronts a make-or-break technical support at 4,150 against a formidable 4,300 resistance ceiling. Across the board, technicals show bearish momentum divergence, while fundamental analysis indicates that until the Middle East transit routes normalize, Asian industrial output will suffer from inflated energy import bills, rendering regional equities highly vulnerable to further capitulation.
Arab Market Indices
Arab market indices present a complex dichotomy, acting as both the geographic epicenter of the geopolitical storm and the primary beneficiaries of the resulting crude oil super-cycle. Saudi Arabia’s Tadawul All Share Index (TASI) surged against the global grain to close near 10,850, fundamentally buoyed by Aramco and the petrochemical sector capitalizing on $90+ oil prices. Technically, TASI is exhibiting a bullish golden cross, with robust support established at 10,500 and a clear runway to test the 11,200 resistance zone in the coming sessions. In the UAE, the Dubai Financial Market General Index (DFMGI) closed at 4,320, while the Abu Dhabi Securities Exchange (ADX) stabilized at 9,450. Both indices are balancing the windfall of energy revenues against the severe fundamental risk of regional military escalation deterring foreign direct investment and tourism. From a technical standpoint, the DFMGI holds critical support at 4,250 with resistance at 4,400, while the ADX is constrained between a 9,300 floor and a 9,650 ceiling. For Monday, institutional capital is expected to aggressively rotate into Gulf state energy heavyweights, treating these specific Arab exchanges as a rare equity-based hedge against the broader stagflationary collapse .
European Market Indices
European market indices are confronting a devastating fundamental reality, being the most exposed region to the energy supply-chain paralysis and subsequent stagflationary pressures. Germany’s DAX plummeted to 20,384, fundamentally crushed by its heavy reliance on manufacturing and imported energy, and it technically breached its 50-day moving average ; it now clings to a fragile support at 20,000, with fierce resistance towering at 20,800. In the UK, the FTSE 100 closed at 8,308, partially cushioned by its high concentration of energy and mining stocks, yet still vulnerable to the broader domestic economic slowdown. The FTSE’s technical posture remains slightly more resilient, identifying firm support at 8,150 and resistance near 8,450. France’s CAC 40 suffered a steep drop to 7,426, driven by luxury sector liquidations as global consumer confidence craters, facing immediate support at 7,300 and a resistance ceiling at 7,600. Technically, the Euro Stoxx volatility index (VSTOXX) has spiked in tandem with its U.S. counterpart, signaling that European asset managers are aggressively buying puts. Fundamentally, with the European Central Bank trapped between an impending recession and imported inflation, Monday’s session threatens a severe gap-down across the continent.
Global Forex Crypto Energy Precious Metals Ferrous Metals Markets Forecast
Forex
Currency markets are dominated by safe-haven flows and monetary policy divergences, with the U.S. Dollar Index (DXY) stabilizing around the 99.00 mark as a primary liquidity refuge. The EUR/USD pair has taken a severe beating, diving below the 1.1600 handle to trade near 1.1560—its lowest since November 2025. The euro is fundamentally weighed down by Europe’s extreme vulnerability to the Middle Eastern energy shock; immediate technical support for EUR/USD is 1.1500, with resistance capped at 1.1650. The USD/JPY pair is hovering near 156.00, caught in a tug-of-war between rising U.S. yields and imminent Bank of Japan intervention risks; support lies at 155.00 and resistance at 158.00. Meanwhile, the Indian Rupee (USD/INR) faced acute fundamental pressure from surging crude oil prices, slipping to record lows near 92.30 before recovering slightly to 91.60. For Monday, the INR remains highly vulnerable; critical support is 91.20, with resistance stationed at the 92.50 all-time high.
Cryptocurrency
Cryptocurrency markets are experiencing extreme volatility, oscillating wildly between geopolitical safe-haven narratives and high-beta risk-off liquidations. Bitcoin (BTC) staged a massive rally to touch $74,000 on the back of Middle East tensions, before institutional profit-taking and leveraged liquidations dragged it back down to the $71,000–$72,600 region. The asset is currently navigating a dangerous pivot, with a significant concentration of long liquidations vulnerable if prices drop to the $54,000 structural base. For Monday, Bitcoin’s immediate technical support is fiercely guarded at $68,000, while the $74,500 level acts as a formidable resistance cap. Ethereum (ETH) continues to lag, trading sideways near $2,066 to $2,126 despite recent ETF inflows; it faces immediate support at $1,950 and strong resistance at $2,250. Fundamentally, with the Crypto Fear & Greed Index fluctuating, tomorrow’s price action will depend heavily on traditional market sentiment—if the equity sell-off deepens, liquidity drains could drag the crypto complex lower.
Energy
The energy sector is the epicenter of current global market panic, driven entirely by the escalating war and the blockade of the Strait of Hormuz. WTI Crude Oil futures erupted, surging over 12% to close at an astonishing $90.90 per barrel, marking its biggest weekly gain in years. Brent Crude similarly rocketed to $92.69 (+8.52%), with Qatar’s Energy Minister warning that a prolonged conflict could force prices up to a catastrophic $150 per barrel, bringing down global economies. For Monday’s session, WTI has immediate fundamental support at $85.00, but faces psychological resistance at the $95.00 to $100.00 barrier. Natural Gas (trading at $3.186, +6.09%) is also catching aggressive bids due to generalized maritime supply chain fears, with support at $3.00 and resistance at $3.40. Until maritime transit normalizes, energy markets will remain hyper-inflated, and traders should expect violent intraday swings on any military headlines.
Precious Metals
Precious metals have definitively reclaimed their status as the ultimate safe-haven assets amidst the geopolitical chaos and stagflationary environment. Gold (XAU/USD) blasted through historical ceilings, trading around $5,158 per ounce, with intra-week highs pushing near $5,298 as investors sought refuge from plunging equities and a weakening labor market. For Monday, Gold’s immediate technical support is firmly established at the $5,050 zone, with aggressive resistance projected at the $5,400 mark. Silver (XAG/USD) outperformed even gold in percentage terms, rallying to $84.33 per ounce (+2.51%) as the gold-to-silver ratio compressed. Silver’s dual fundamental role as both an industrial input and a monetary hedge makes it highly attractive; support is layered at $80.00, with overhead resistance at $90.00. The technical posture for both metals is overwhelmingly bullish, and any weakness in the U.S. dollar on Monday will be utilized by institutions to accumulate further.
Ferrous Metals
Despite the chaos in energy and equities, ferrous metals are demonstrating steady resilience, buoyed by targeted industrial demand and supply chain bottlenecks in key regions. Steel prices edged higher by 1.04% to trade at 3,099 CNY/Tonne, reflecting sustained infrastructure and manufacturing baselines in Asian economies despite broader macro headwinds. Iron Ore (CNY) also saw a respectable gain of 1.71%, closing at 772.00. The ferrous complex is currently insulated from the absolute worst of the Middle East crisis, focusing instead on Chinese stimulus measures and domestic inventory levels. For Monday, Steel prices have a solid technical support base at 3,000, with resistance at 3,200. Iron Ore’s immediate support rests at 750, with resistance at 800. Fundamentally, while the energy spike threatens to increase input and freight costs for metal producers, the baseline demand curve remains intact, suggesting a sideways-to-bullish trajectory.
As markets navigate a packed economic environment, Monday’s events will set the tone for the rest of the week’s inflation data.
| Time (GMT) | Event / Data Release | Forecast | Previous | Impact |
| 01:30 AM | China CPI (YoY) (Feb) | 0.2% | 0.2% | Medium |
| 01:30 AM | China PPI (YoY) (Feb) | -1.4% | -1.4% | Medium |
| 05:00 AM | Japan Leading Index (Jan) | 111.0 | 111.0 | Low |
| 06:30 AM | Dutch Consumer Price Index (Feb) | — | — | Low |
| 02:00 PM | US NY Fed 1-Year Consumer Inflation Exp. | — | 3.1% | High |
| 02:30 PM | US 3-Month & 6-Month Bill Auctions | — | 3.61% / 3.53% | Medium |
| All Day | Eurogroup Meetings | — | — | Medium |
Data compiled from recent financial releases.
For training and educational purposes, the overarching lesson from the March 8, 2026 weekend is the mechanics of a “Stagflationary Shock” and its impact on cross-asset correlations. When a severe geopolitical event (the Middle East blockade) causes an exogenous energy spike (Crude hitting $90+) precisely when domestic economic data weakens (NFP losing 92,000 jobs), it creates a toxic environment for equities. Trainee traders must observe how the traditional “bad news is good news” paradigm fails here; the Fed cannot easily cut rates to save the labor market because the oil spike threatens to re-accelerate inflation. This forces capital into non-yielding safe havens like Gold and Silver, which broke out spectacularly, and causes high-beta assets like tech stocks to de-leverage rapidly.
Secondly, analyzing the Indian market provides a masterclass in “Institutional Decoupling.” Despite global panic and massive FII sell-offs, the Nifty 50 absorbed the shock due to historically strong DII buying. For a professional analyst, this “Liquidity Pivot” demonstrates that domestic SIP flows can establish a synthetic floor independent of Western panic. However, traders must remain exceptionally vigilant: with the India VIX remaining volatile and the Rupee under extreme pressure from the ballooning oil import bill, any further military escalation could eventually break this domestic defense. The primary strategy for tomorrow is strict risk management, reducing position sizing, and favoring defensive value sectors over cyclical growth.
Legal Disclaimer & Liability Waiver – aiTrendview.com

All content, reports, signals, analytics, forecasts, and materials published on aiTrendview.com are fully AI-generated outputs produced through automated systems with zero human research, manual validation, editorial review, or professional intervention. This platform does not provide financial, investment, trading, legal, tax, or professional advice of any kind. aiTrendview.com, its owners, affiliates, and associated entities are not registered with SEBI or any other regulatory authority as investment advisors, research analysts, brokers, or financial consultants. All data is autonomously aggregated from publicly available sources and algorithmic processes that may contain inaccuracies, delays, omissions, or technical errors. Users are solely and exclusively responsible for independently verifying all information before making any financial, legal, or commercial decisions.
By accessing or using this platform, you expressly acknowledge and agree that any reliance on the information provided is entirely at your own risk. aiTrendview.com assumes absolutely no liability for any direct, indirect, incidental, consequential, financial, legal, trading, or other losses arising from the use of, reliance upon, or inability to use any content or data published. Nothing on this platform shall be construed as a solicitation, endorsement, or recommendation to buy, sell, hold, or speculate in any security, derivative, commodity, cryptocurrency, or financial instrument. All intellectual property, including but not limited to algorithms, report structures, proprietary formats, branding, and system outputs, is strictly protected under applicable intellectual property laws. Unauthorized reproduction, redistribution, modification, or commercial exploitation is strictly prohibited and may result in civil and criminal legal action.