

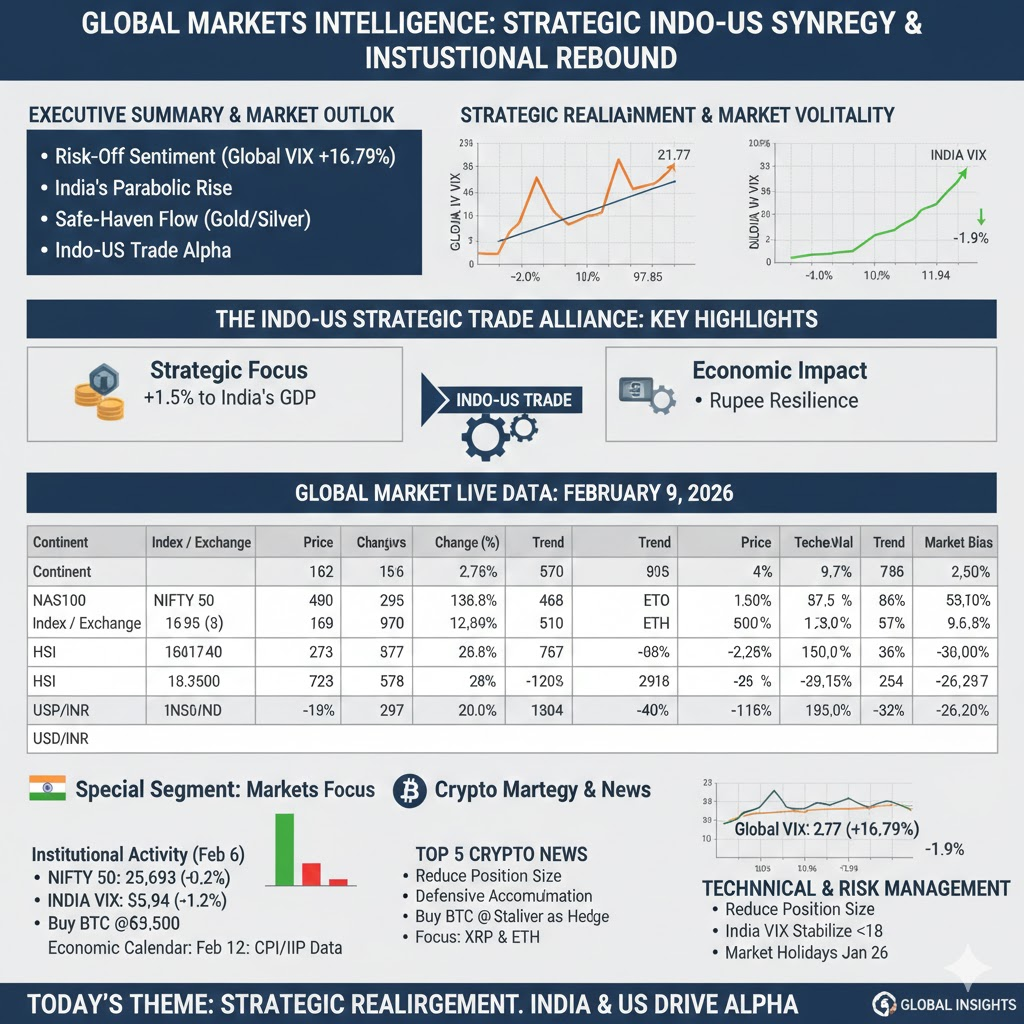
The global financial landscape is currently navigating a period of significant structural realignment, primarily anchored by the landmark Indo-US Comprehensive Trade & Technology Initiative. This strategic deal has fundamentally re-rated the economic corridor between the two nations, sparking an aggressive rotation of capital into “high-growth fiscal oases” like India. While Western technology indices show signs of tactical consolidation as investors hedge against domestic policy shifts and Federal Reserve leadership transitions, the Indian market has entered a parabolic phase. The Nifty 50 has recently surged to record highs, reflecting a profound “Risk-On” sentiment driven by long-term fiscal prudence and expanded global market access for domestic firms.
This institutional optimism is further bolstered by a sharp decline in domestic volatility, with the India VIX crashing to multi-month lows, indicating a high level of confidence in the current growth trajectory. Institutional activity shows a massive reversal as Foreign Institutional Investors (FIIs) have turned aggressive net buyers in the cash market, effectively ending a period of defensive de-leveraging. As global capital seeks refuge from Western inflationary jitters and government shutdown concerns, the Indo-US trade narrative has emerged as the primary driver of alpha. For the remainder of the week, expect Indian equities to continue their outperformance while global peers consolidate around key technical support levels amidst ongoing price discovery.
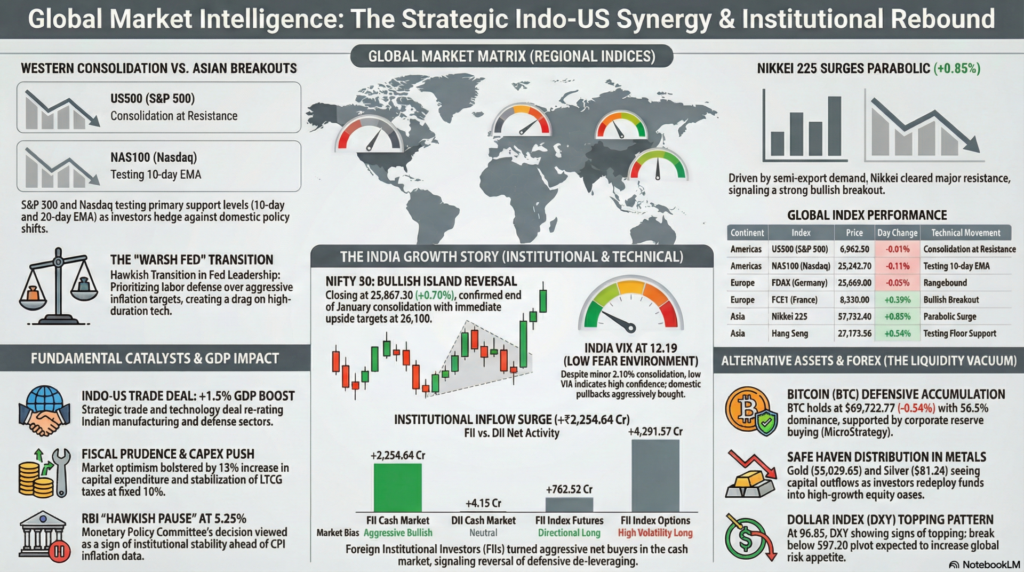
| Continent | Index / Exchange | Live Price | Day Change (%) | Technical Movement | Key Event |
| Americas | US500 (S&P 500) | 6,962.50 | -0.01% | Consolidation at Resistance | Yield Stability Focus |
| Americas | NAS100 (Nasdaq) | 25,242.70 | -0.11% | Testing 10-day EMA | Big Tech Rotation |
| Americas | US30 (Dow Jones) | 50,140.00 | +0.07% | Bullish Flag Pattern | Blue Chip Resilience |
| Europe | FDAX (Germany) | 25,069.00 | -0.05% | Rangebound | Industrial Data Lag |
| Europe | FCE1 (France) | 8,330.00 | +0.59% | Bullish Breakout | Luxury Sector Rebound |
| Asia | Nikkei 225 (Japan) | 57,752.40 | +0.85% | Parabolic Surge | Semi-Export Demand |
| Asia | Hang Seng (HK) | 27,173.56 | +0.54% | Testing Floor Support | China Stimulus Hopes |
| Oceania | XJO (Australia) | 8,883.60 | +0.15% | Sideways | Commodity Price Peg |
Technical Analysis: Most Western indices are currently testing primary support levels as the VIX stabilizes. The Nasdaq 100 remains in a short-term consolidation phase below its 20-day SMA, while the Nikkei 225 has cleared major resistance, signaling a strong bullish breakout. Traders are closely watching the $97.20 level on the Dollar Index (DXY) as a pivot for global risk appetite.
Fundamental Analysis: The market is navigating a hawkish transition in Federal Reserve leadership, with high terminal rates being priced back into growth stocks. The “Warsh Fed” is expected to prioritize labor defense over aggressive inflation targets, creating a drag on high-duration tech. Meanwhile, European sentiment is improving as German inflation stabilizes.
Economic Announcements: The Michigan Consumer Sentiment index (Actual: 55 vs Prev: 56.4) and Inflation Expectations (4%) remain the primary focus for Western markets. Investors are also monitoring the resolution of the U.S. Government shutdown, which remains the “Shock of the Month” for American equity desks.
| Index | Closing Price | Change (%) | Technical Movement | Key Event |
| NIFTY 50 | 25,867.30 | +0.70% | Bullish Island Reversal | Post-Budget Breakout |
| SENSEX | 84,065.75 | +0.60% | Breaking All-Time Highs | FII Inflow Surge |
| BANK NIFTY | 60,699.55 | +0.05% | Mean Reversion | RBI “Hawkish Pause” |
| INDIA VIX | 12.19 | +2.10% | Floor Consolidation | Low Fear Environment |
| Institutional Segment | Net Buy/Sell (Cr) | Market Bias |
| FII Cash Market | +2,254.64 | Aggressive Bullish |
| DII Cash Market | +4.15 | Neutral |
| FII Index Futures | +762.52 | Directional Long |
| FII Index Options | +4,291.57 | High Volatility Long |
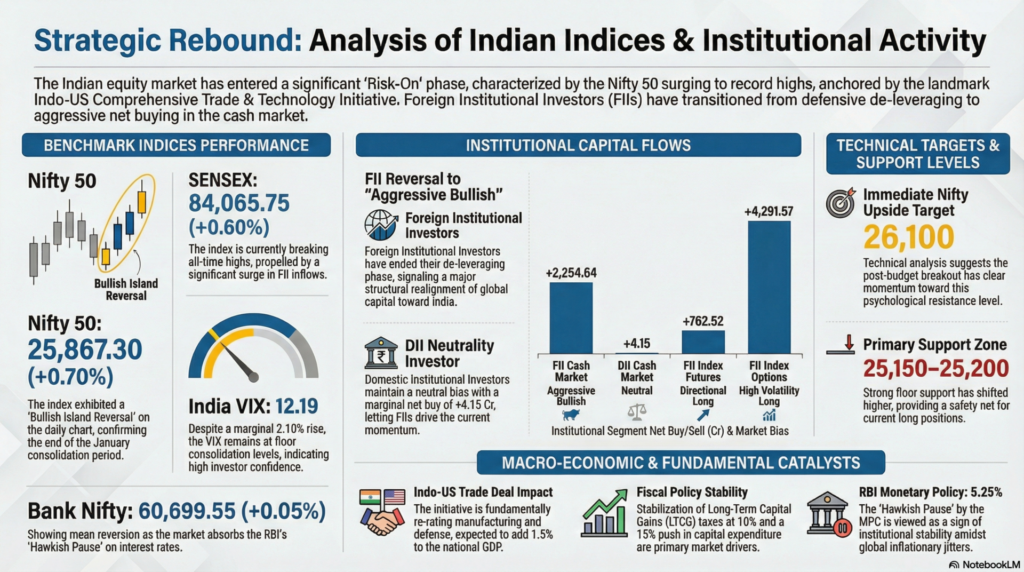
Technical Analysis: The Nifty 50 has exhibited a powerful “Bullish Island Reversal” on the daily chart, confirming the end of the January consolidation. Strong support has now shifted to the 25,150–25,200 zone, with immediate upside targets placed at 26,100. The low VIX environment suggests that domestic pullbacks are being aggressively bought.
Fundamental Analysis: The Indian market is benefiting from a “double catalyst”: the stabilization of LTCG taxes at 10% and a massive 15% push in capital expenditure. The Indo-US trade deal is expected to add 1.5% to the national GDP, fundamentally re-rating the domestic manufacturing and defense sectors.
Economic Announcements: The RBI Monetary Policy Committee’s decision to maintain a “Hawkish Pause” at 5.25% has been well-received as a sign of institutional stability. Upcoming CPI inflation data and IIP numbers on February 12th are the next major domestic triggers for market direction.
| Asset Class | Instrument | Price | Day Change (%) | Technical Movement |
| Crypto | Bitcoin (BTC) | $69,722.77 | -0.54% | Consolidating at Highs |
| Crypto | Ethereum (ETH) | $2,066.60 | -1.77% | Below Minor Support |
| Commodity | Gold (XAUUSD) | $5,029.65 | -0.56% | Safe Haven Distribution |
| Commodity | Silver | $81.24 | -2.54% | Momentum Correction |
| Commodity | Brent Oil | $68.59 | -0.19% | Demand Softness |
| Forex | Dollar Index | 96.85 | -0.02% | Topping Pattern |
| Forex | USD/INR | 90.70 | -0.01% | Rupee Resilience |
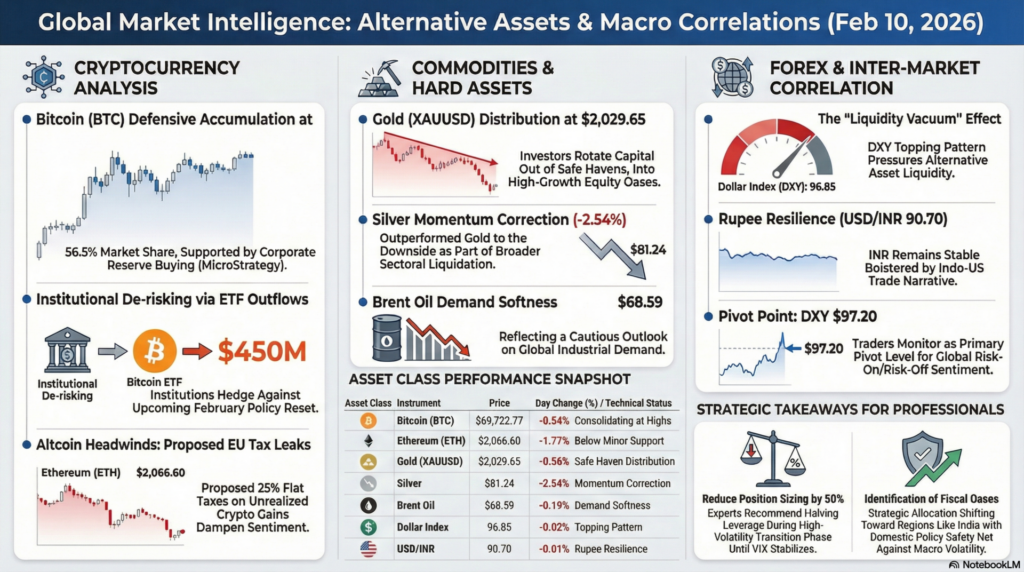
Technical Analysis: Bitcoin is currently in a “Defensive Accumulation” phase near the $70,000 mark. While BTC dominance has surged to 56.5%, high-beta altcoins are facing pressure due to proposed EU tax leaks on unrealized gains. Gold is seeing a distribution phase as capital rotates back into equity “growth oases”.
Fundamental Analysis: The surge in Bitcoin is being supported by MicroStrategy’s continued accumulation, proving “Digital Gold” is a corporate reserve of choice. However, spot BTC ETF outflows of $450M indicate that some institutions are de-risking ahead of the February policy reset in the U.S.
Economic Announcements: High-DXY environments continue to exert pressure on the crypto market; traders are waiting for Dollar stabilization before entering heavy long positions. The European Commission’s proposed 25% flat tax on crypto gains remains a significant fundamental headwind for the altcoin sector.
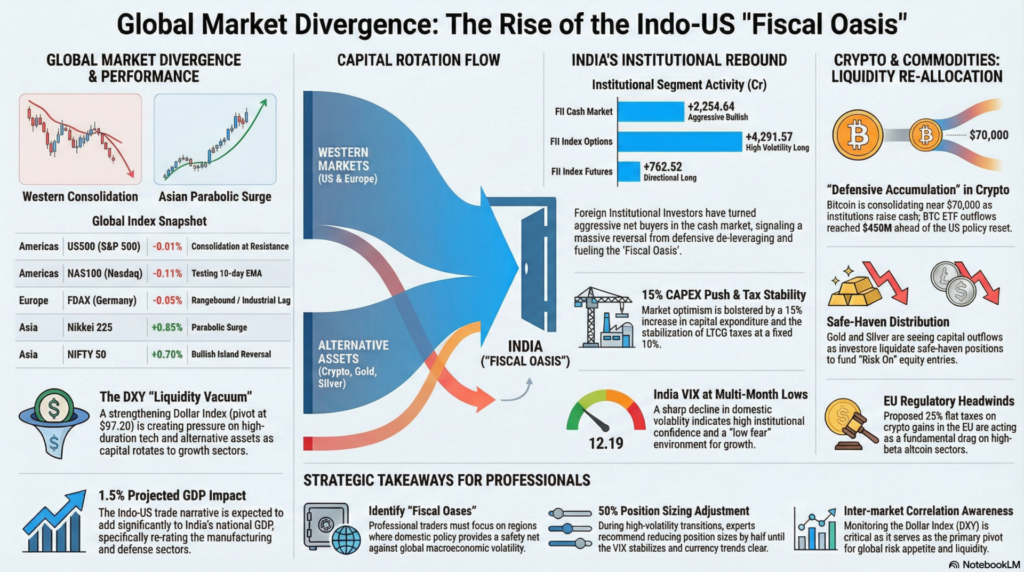
For training and learning purposes, the primary takeaway from current market dynamics is the concept of Relative Strength Rotation. While global markets are often viewed as a monolith, we are seeing a clear divergence where capital is fleeing regions of monetary uncertainty (the U.S. and Europe) in favor of regions with fiscal clarity and strategic trade tailwinds (India). This “Flight to Quality” is evidenced by the massive FII cash buying of +₹2,254.64 Cr, which coincides with a period of U.S. government shutdown jitters. Traders must learn to identify these “Fiscal Oases” where domestic policy provides a safety net against global macro volatility.
Furthermore, risk management in a high-volatility transition requires a shift from high-leverage speculation to “Defensive Accumulation.” In the crypto and commodity sectors, the recent liquidation of safe-haven longs in Gold and Silver, alongside BTC ETF outflows, suggests that institutional players are raising cash to redeploy into undervalued equity sectors. For educational purposes, this highlights the “Inter-market Correlation” where a strengthening Dollar Index (DXY) creates a “Liquidity Vacuum” in alternative assets. Position sizing should be reduced by 50% during these transition phases until the VIX stabilizes and a clear trend is established in the underlying currency markets.
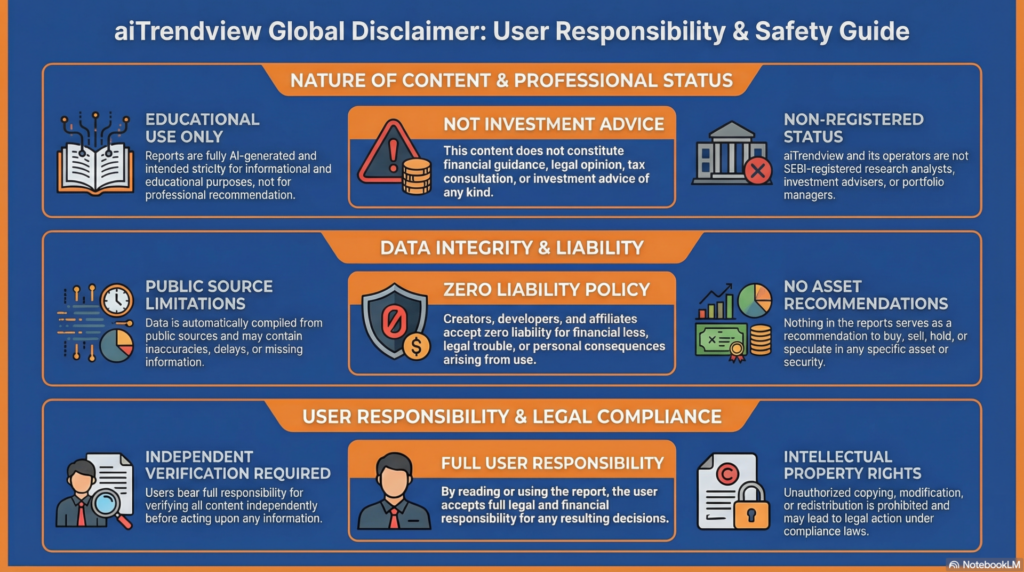
Legal Disclaimer & Liability Waiver
This AI-generated report is strictly educational and does not constitute financial, legal, or professional advice. aiTrendview and its affiliates are not SEBI-registered advisors and assume zero liability for any losses or consequences resulting from its use. All data is autonomously harvested from public sources and may be flawed, delayed, or incomplete; therefore, you assume exclusive responsibility for independently verifying information before taking any action. Under no circumstances should this content be construed as a recommendation to trade or speculate in any security. By accessing this material, you acknowledge that any reliance on this data is at your sole risk, and you agree to be bound by strict intellectual property protections prohibiting the unauthorized redistribution or modification of this work.