Find Dividend Data on TradingView

Tradingview, Technical, Fundamental, Economic, Market Report, Crypto Market Report, Commodity Market Report, Gold, Silver, Crudeoil, Nifty, Banknifty, Sensex, Forex,

How to Find Dividend Data on TradingView: A Tutorial

For income-focused investors, the dividend yield is a critical metric. It measures how much a company pays out in dividends each year relative to its stock price. A recent tutorial from TradingView explains exactly how to find, analyze, and interpret this data using their built-in tools.

Here is a summary of the key points to help you research dividend stocks effectively.

What is Dividend Yield?

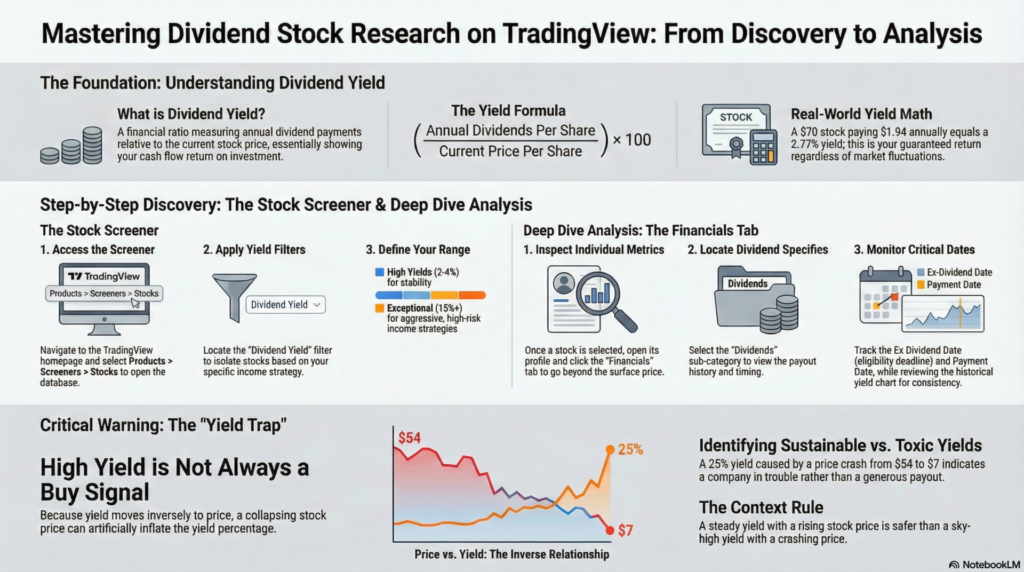
The dividend yield is a financial ratio that shows how much cash flow you are getting for your money.

  • Calculation: (Annual Dividends Per Share / Current Price Per Share) × 100.
  • Example: If a stock costs $70 and pays $1.94 in dividends per year, the yield is approximately 2.77%. This means you earn a 2.77% return on your investment annually from dividends alone, regardless of stock price movement.

How to Find High-Yield Stocks

The video demonstrates using the Stock Screener to filter for dividend opportunities:

  1. Go to Products > Screeners > Stocks at the top of the TradingView homepage.
  2. In the screener filters, locate the Dividend Yield option.
  3. Select a range that fits your strategy (e.g., “High” for 2-4% or “Exceptional” for 15%+).

Analyzing the Data

Once you select a stock (e.g., Coca-Cola), you can dive deeper into its specific metrics:

  1. Click on the Financials tab.
  2. Select Dividends.
  3. Here, you will see key stats like the Ex-Dividend Date, Payment Date, and a historical chart of the yield over time.

A Critical Warning: The “Yield Trap”

The tutorial offers a crucial piece of advice: A high yield is not always a buy signal.

  • The Math: Since yield moves inversely to price, if a stock’s price crashes while the dividend payout stays the same, the yield will spike.
  • Real-World Example: The video highlights a stock with a massive 25% yield. Upon closer inspection, the stock price had collapsed from $54 to $7 over a few years. This suggests the company is in trouble, and that “attractive” yield might be unsustainable or about to be cut.

Key Takeaway: Always check the context. A steady yield from a company with a rising stock price (like Coca-Cola) is often safer than a sky-high yield from a company with a crashing stock price.

Tradingview, Technical, Fundamental, Economic, Market Report, Crypto Market Report, Commodity Market Report, Gold, Silver, Crudeoil, Nifty, Banknifty, Sensex, Forex,

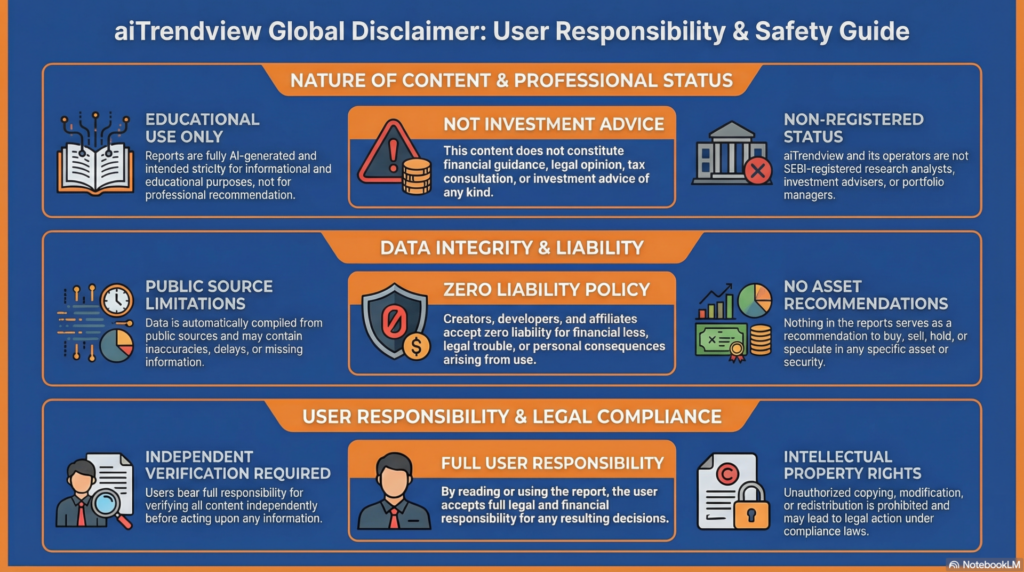
Legal Disclaimer & Liability Waiver

This AI-generated report is strictly educational and does not constitute financial, legal, or professional advice. aiTrendview and its affiliates are not SEBI-registered advisors and assume zero liability for any losses or consequences resulting from its use. All data is autonomously harvested from public sources and may be flawed, delayed, or incomplete; therefore, you assume exclusive responsibility for independently verifying information before taking any action. Under no circumstances should this content be construed as a recommendation to trade or speculate in any security. By accessing this material, you acknowledge that any reliance on this data is at your sole risk, and you agree to be bound by strict intellectual property protections prohibiting the unauthorized redistribution or modification of this work.

aiTrendview Disclaimer
Share this post :
Facebook
WhatsApp

Start To Invest And Earn More

Lorem ipsum dolor sit amet consectetur adipiscing elit dolor

Notice: Function WP_Scripts::add was called incorrectly. The script with the handle "hcaptcha-elementor-pro" was enqueued with dependencies that are not registered: hcaptcha. Please see Debugging in WordPress for more information. (This message was added in version 6.9.1.) in /var/www/vhosts/aitrendview.com/httpdocs/wp-includes/functions.php on line 6131