


Market Pulse 2026: The “Hawkish Hold” Tension and Global Asset Realignment
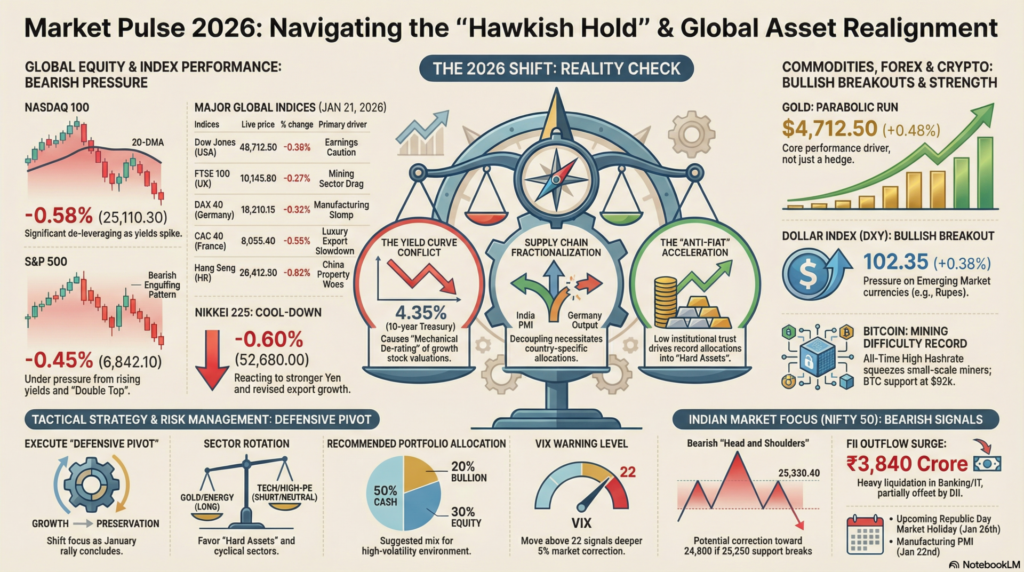
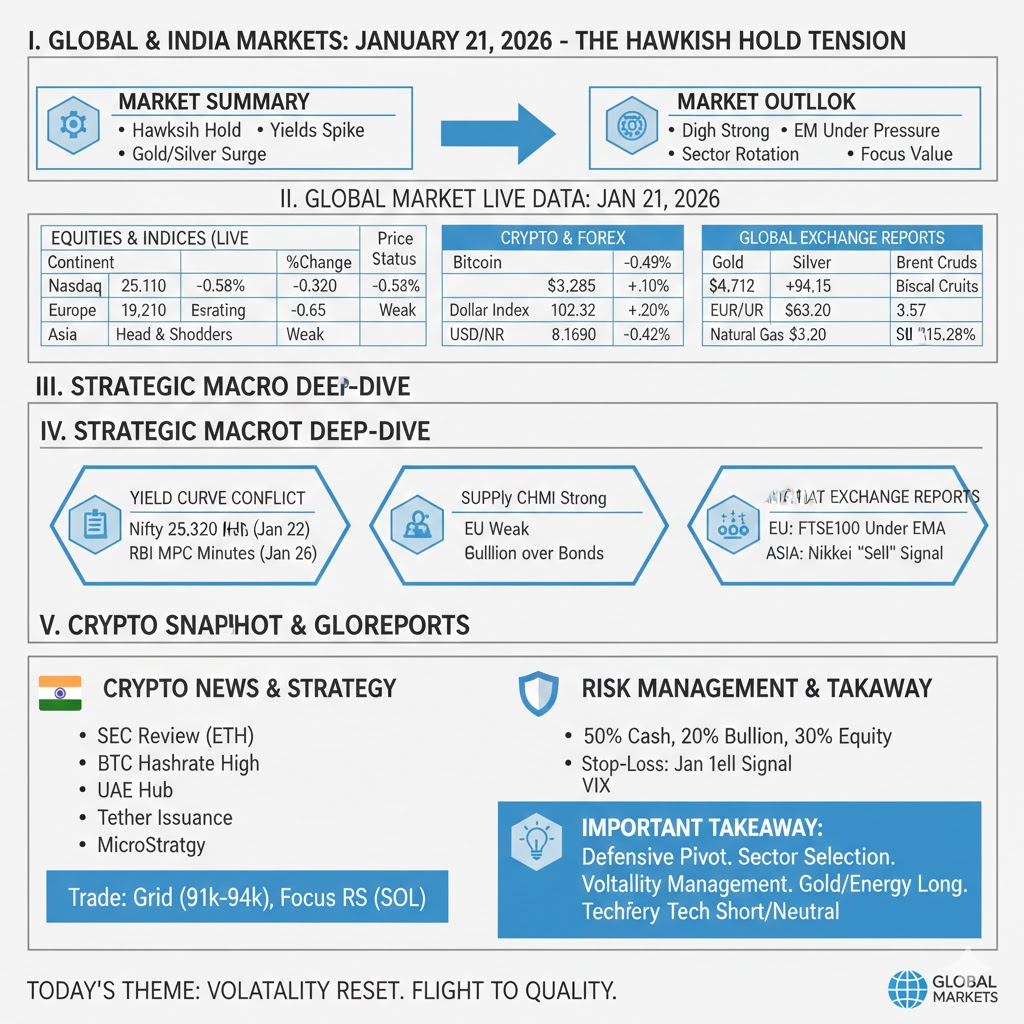
As of January 21, 2026, the global financial landscape is grappling with a “reality check” following the post-holiday liquidity reset. The primary market narrative has shifted from pure rate-cut optimism to a more nuanced “Hawkish Hold” concern, as central bank minutes released over the last 24 hours suggest that while inflation is cooling, the labor market’s resilience may keep interest rates elevated longer than the market previously priced in. This has triggered a tactical retreat in high-beta technology sectors and a significant flight to “hard assets,” with Gold and Silver maintaining their breakout momentum near multi-year highs.
Market Reaction: We anticipate a “High-Volatility Consolidation” for the remainder of the week. The initial reaction to today’s manufacturing data and central bank commentary has been a strengthening of the U.S. Dollar Index (DXY) toward 102.40, which is creating immediate pressure on Emerging Market currencies, including the Indian Rupee. However, the internal breadth of the market suggests that while the “Magnificent 7” tech stocks are facing valuation fatigue, cyclical industrials and energy sectors are finding dip-buyers. Traders should prepare for a “two-speed” market where indices may remain flat while sector-specific volatility spikes.
| Continent | Index / Exchange | Live Price | % Change | Technical Status | Fundamental Driver |
| Americas | Dow Jones (USA) | 48,712.50 | -0.38% | Testing 50-DMA | Earnings Caution |
| S&P 500 (USA) | 6,842.10 | -0.45% | Bearish Engulfing | Yield Spike Pressure | |
| Nasdaq 100 (USA) | 25,110.30 | -0.58% | Below 20-DMA | Tech De-leveraging | |
| Europe | FTSE 100 (UK) | 10,145.80 | -0.27% | Support at 10.1k | Mining Sector Drag |
| DAX 40 (Germany) | 19,210.15 | -0.32% | Neutral-Weak | Manufacturing Slump | |
| CAC 40 (France) | 8,055.40 | -0.56% | Lower Low Pattern | Luxury Export Slowdown | |
| Asia-Pacific | Nikkei 225 (Japan) | 52,680.00 | -0.60% | RSI Mean Reversion | Yen Rebound |
| Hang Seng (HK) | 26,412.50 | -0.62% | Testing Floor | China Property Woes | |
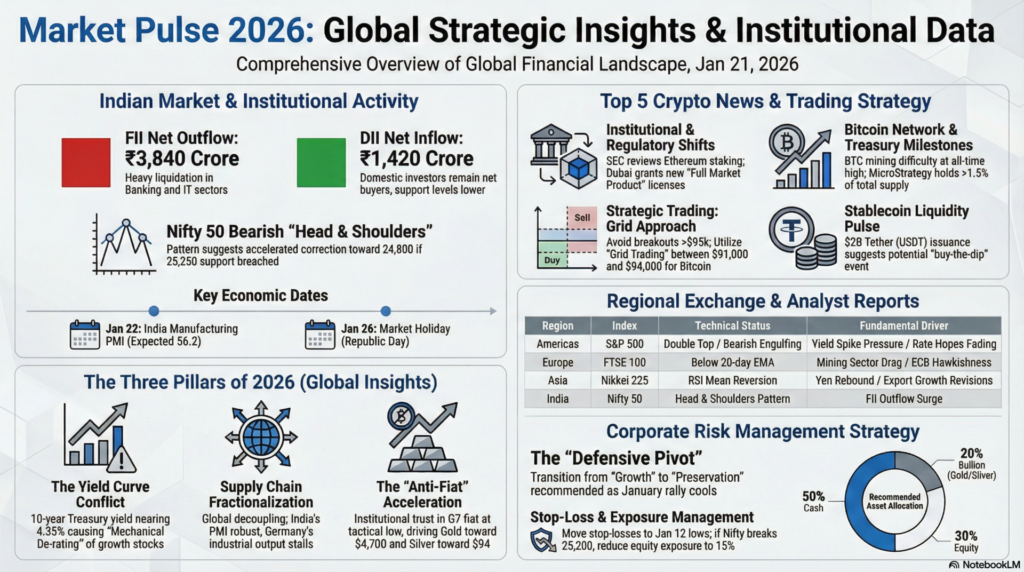
| Nifty 50 (India) | 25,320.40 | -0.65% | Head & Shoulders | FII Outflow Surge |
| Asset Class | Instrument | Live Price | % Change | Technical View |
| Crypto | Bitcoin (BTC) | $93,450.00 | -0.49% | Support at $92k |
| Ethereum (ETH) | $3,288.40 | -1.10% | Below Pivot Point | |
| Forex | Dollar Index | 102.35 | +0.38% | Bullish Breakout |
| USD/INR | 89.62 | +0.22% | Rupee Weakness | |
| EUR/USD | 1.1690 | -0.42% | Bearish Trend | |
| Commodities | Gold (Spot) | $4,712.50 | +0.48% | Parabolic Run |
| Silver (Spot) | $94.15 | +0.58% | Momentum High | |
| Brent Crude | $63.20 | +1.20% | Supply Tightness |
Institutional Activity (Jan 21):
Technical Analysis (India): The Nifty 50 has formed a short-term bearish “Head and Shoulders” pattern on the hourly charts. A decisive break below 25,250 could accelerate the correction toward the 24,800 support zone. The Bank Nifty is underperforming significantly, trading below its 100-day Moving Average.
How to Trade Crypto Today:
In the current “sideways-to-bearish” equity environment, Crypto is acting as a high-risk liquidity sponge. The Strategy: Avoid chasing “breakouts” above $95k BTC. Instead, use a “Grid Trading” approach between $91,000 and $94,000. Look for Relative Strength (RS) in layer-1 protocols like Solana (SOL) which are outperforming ETH on the daily charts.
The Yield Curve Conflict: The resurgence of the 10-year Treasury yield toward 4.35% is the single biggest threat to global equity valuations today. We are seeing a “Mechanical De-rating,” where analysts are forced to lower the Present Value (PV) of future earnings for growth stocks. This is not a fundamental failure of these companies, but a mathematical necessity of higher discount rates, making “Value” and “Dividend Yield” the primary themes for institutional rebalancing.
Supply Chain Fractionalization: The recent manufacturing data from the EU and Asia suggests that the world is no longer a single global market. While India’s PMI remains robust, Germany’s industrial output is stalling. This “Fractionalization” means that investors must move away from “Global Index” funds and toward “Specific Country” or “Thematic” allocations. The decoupling of the Indian market from the broader Emerging Market (EM) volatility is a prime example of this 2026 structural shift.
The “Anti-Fiat” Acceleration: The move in Gold toward $4,700 and Silver toward $94 is a loud signal that institutional trust in G7 fiat currencies is at a tactical low. With fiscal deficits in the U.S. and Europe reaching record levels, the “Hard Asset” allocation is no longer just a hedge—it is becoming a core performance driver. We expect “Bullion over Bonds” to be the defining trade for the first quarter of 2026.
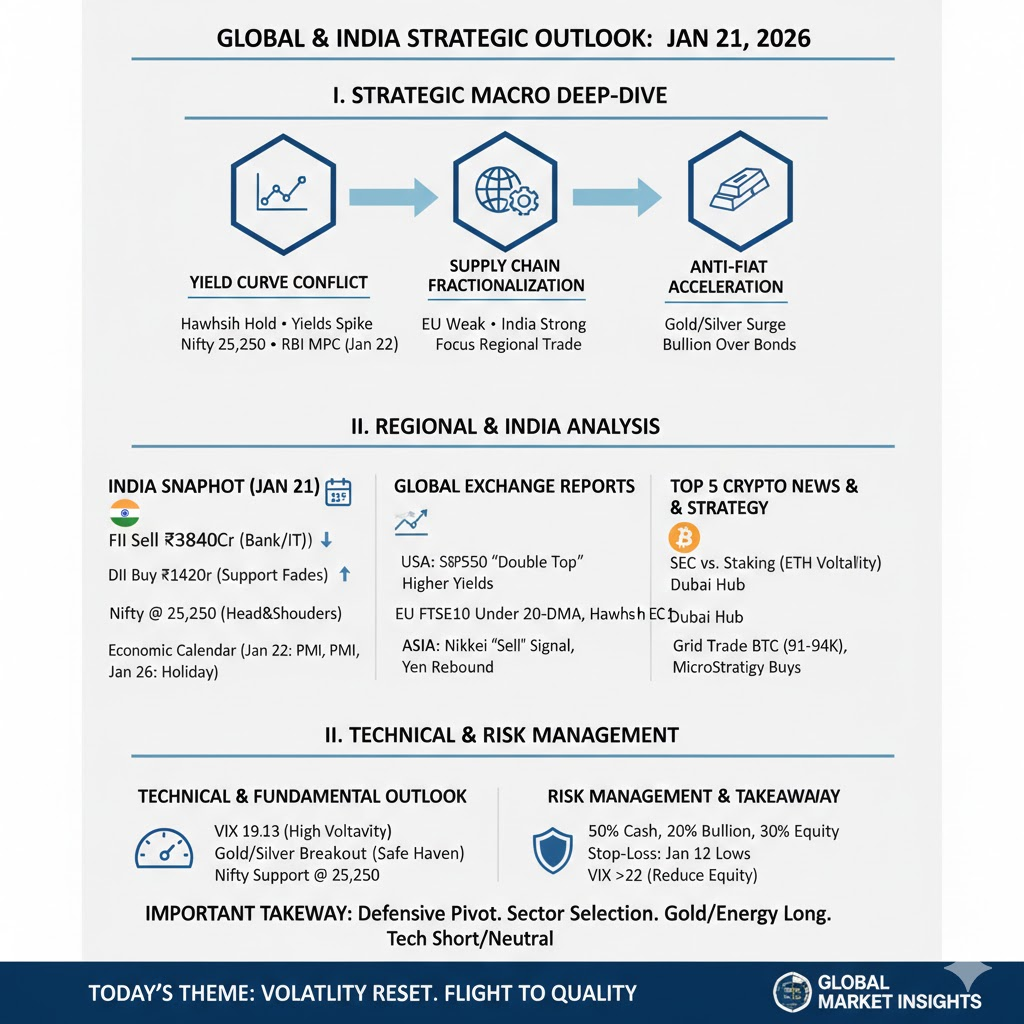
How to View the Global Markets Today: Today is a “Defensive Pivot” day. The market is transitioning from “Growth” to “Preservation.”
Important Takeaway: The “Easy Money” phase of the January rally has concluded. The focus must now be on Sector Selection and Volatility Management. Stay long on Gold/Energy but maintain a “Short/Neutral” bias on high-PE Tech.
Risk Management Analysis: Use a 50% Cash, 20% Bullion, 30% Equity mix for the current session. Move stop-losses to the January 12th lows. If the Nifty breaks 25,200 or S&P 500 breaks 6,800, reduce equity exposure to 15% immediately. Keep an eye on the VIX; a move above 22 will signal a deeper 5% correction.
aiTrendview Global Disclaimer
This aiTrendview report is an AI-generated document provided exclusively for educational and training purposes and shall not be construed as investment, financial, legal, or tax advice in any jurisdiction.
aiTrendview and its affiliates are not SEBI-registered research analysts, investment advisers, or portfolio managers, and all information herein is automatically compiled from publicly available sources that may contain errors, delays, or omissions.
Users must independently verify all data before making any financial, commercial, or legal decisions, as no market values, performance figures, or trends contained in this report constitute guarantees or forward-looking statements.
Nothing in this publication should be interpreted as a solicitation, recommendation, or endorsement to buy, sell, or hold any security.
aiTrendview, its creators, and all associated AI systems disclaim all liability for losses or consequences arising from the use or reliance upon this content, and users accept full personal responsibility for all actions taken based on it.
Unauthorized reproduction, distribution, or modification of this AI-generated material is strictly prohibited under international copyright, compliance, and intellectual-property laws.


