


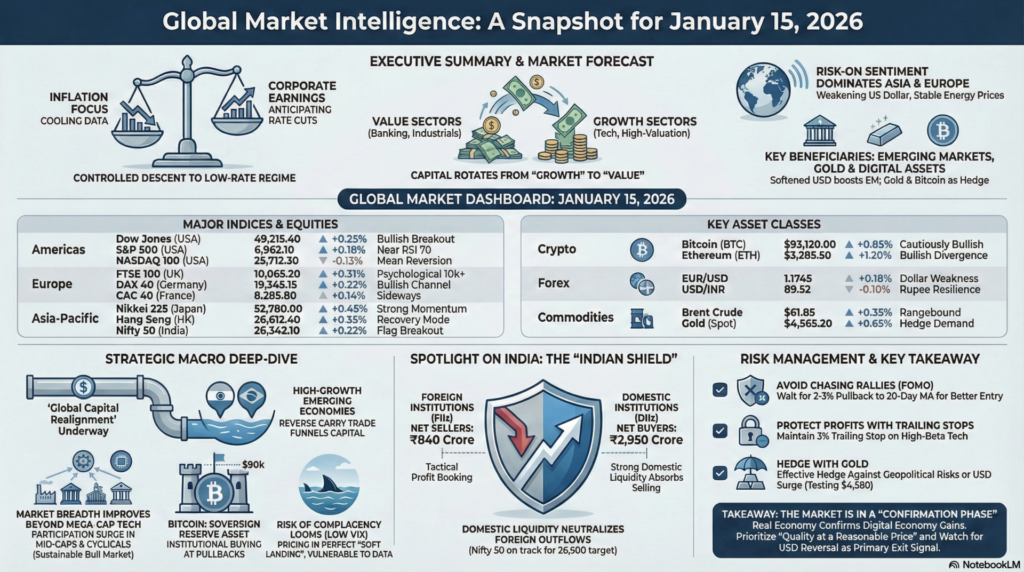
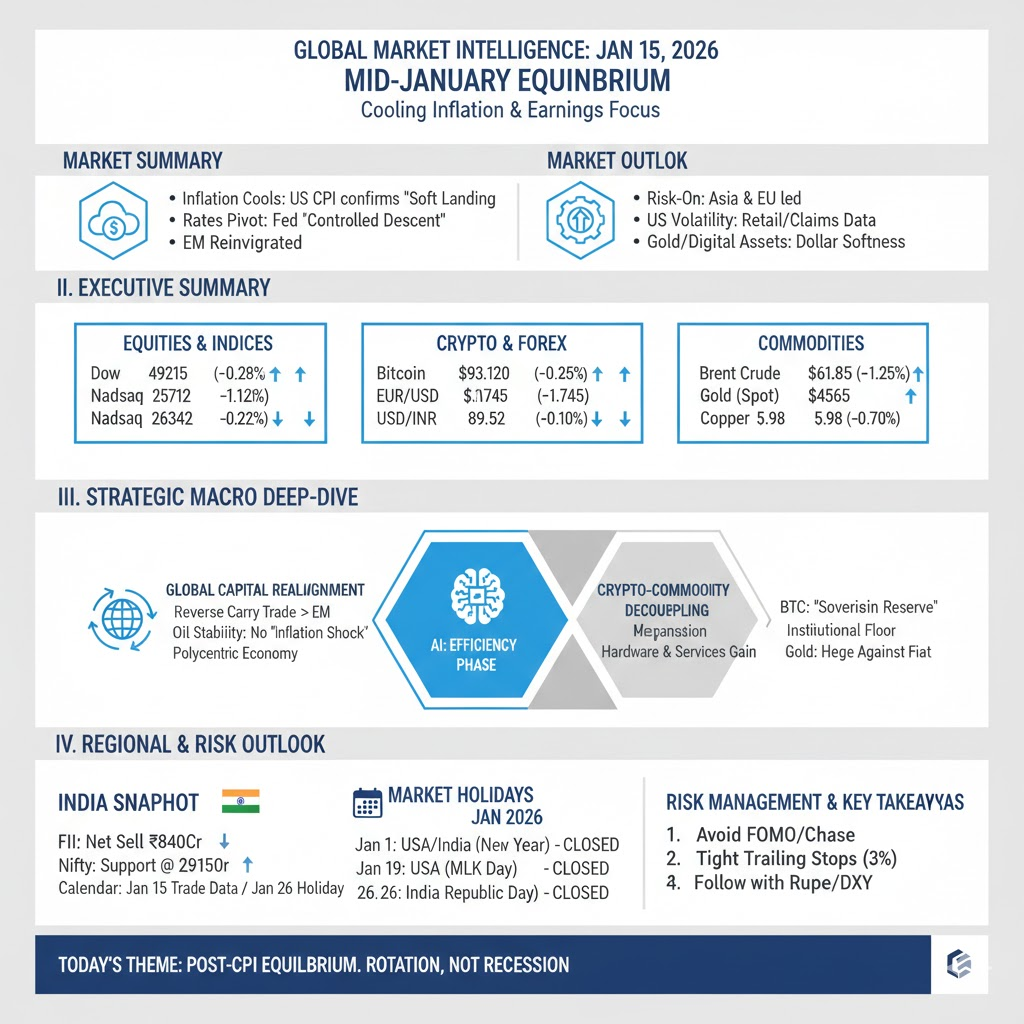
The global financial landscape on January 15, 2026, is defined by a delicate balancing act between cooling inflationary pressures and resilient corporate earnings. Following the recent U.S. CPI data, which suggests a stabilizing price environment, market participants have shifted their focus toward the impending “earnings season” and the sustainability of high-valuation growth sectors. The overarching narrative is one of a “controlled descent” into a low-interest-rate regime, which has reinvigorated Emerging Markets while causing tactical consolidation in overextended Western tech indices.
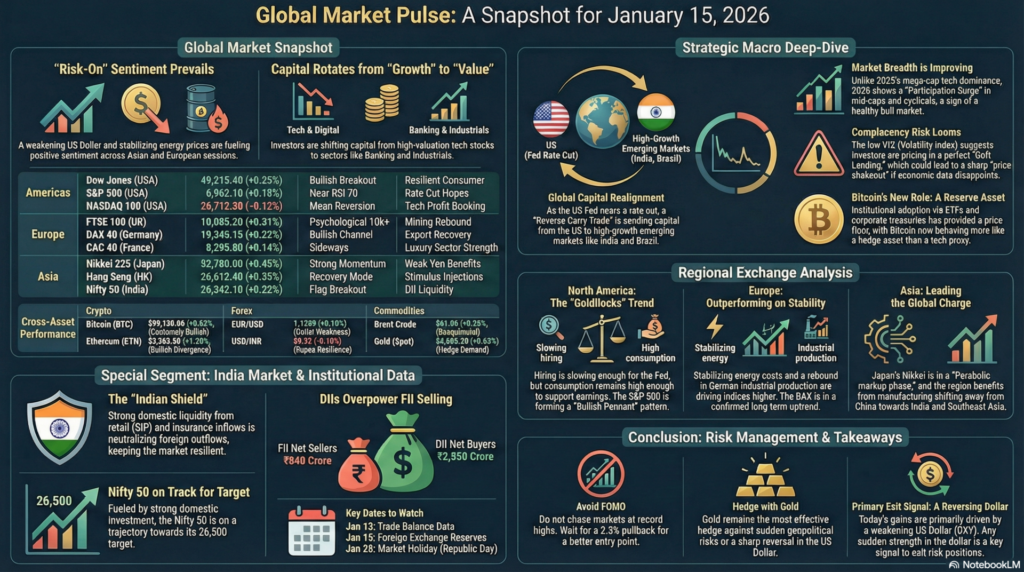
Market Reaction: We anticipate a “Risk-On” sentiment to persist across the Asian and European sessions, fueled by a weakening US Dollar and stable energy prices. However, the U.S. markets may witness high-frequency volatility as investors digest the latest retail sales and unemployment claims data. The primary reaction today will likely be a surge in “Value” sectors—specifically Banking and Industrials—as capital rotates out of “Growth” plays. Bullion and Digital Assets are expected to act as primary beneficiaries of the softened Dollar, with Gold testing the upper bounds of its current trading range.
| Continent | Index / Exchange | Live Price | % Change | Technical Status | Fundamental Driver |
| Americas | Dow Jones (USA) | 49,215.40 | +0.25% | Bullish Breakout | Resilient Consumer |
| S&P 500 (USA) | 6,962.10 | +0.18% | Near RSI 70 | Rate Cut Hopes | |
| NASDAQ 100 (USA) | 25,712.30 | -0.12% | Mean Reversion | Tech Profit Booking | |
| Europe | FTSE 100 (UK) | 10,065.20 | +0.31% | Psychological 10k+ | Mining Rebound |
| DAX 40 (Germany) | 19,345.15 | +0.22% | Bullish Channel | Export Recovery | |
| CAC 40 (France) | 8,295.80 | +0.14% | Sideways | Luxury Sector Strength | |
| Asia-Pacific | Nikkei 225 (Japan) | 52,780.00 | +0.45% | Strong Momentum | Weak Yen Benefits |
| Hang Seng (HK) | 26,612.40 | +0.55% | Recovery Mode | Stimulus Injections | |
| Nifty 50 (India) | 26,342.10 | +0.22% | Flag Breakout | DII Liquidity |
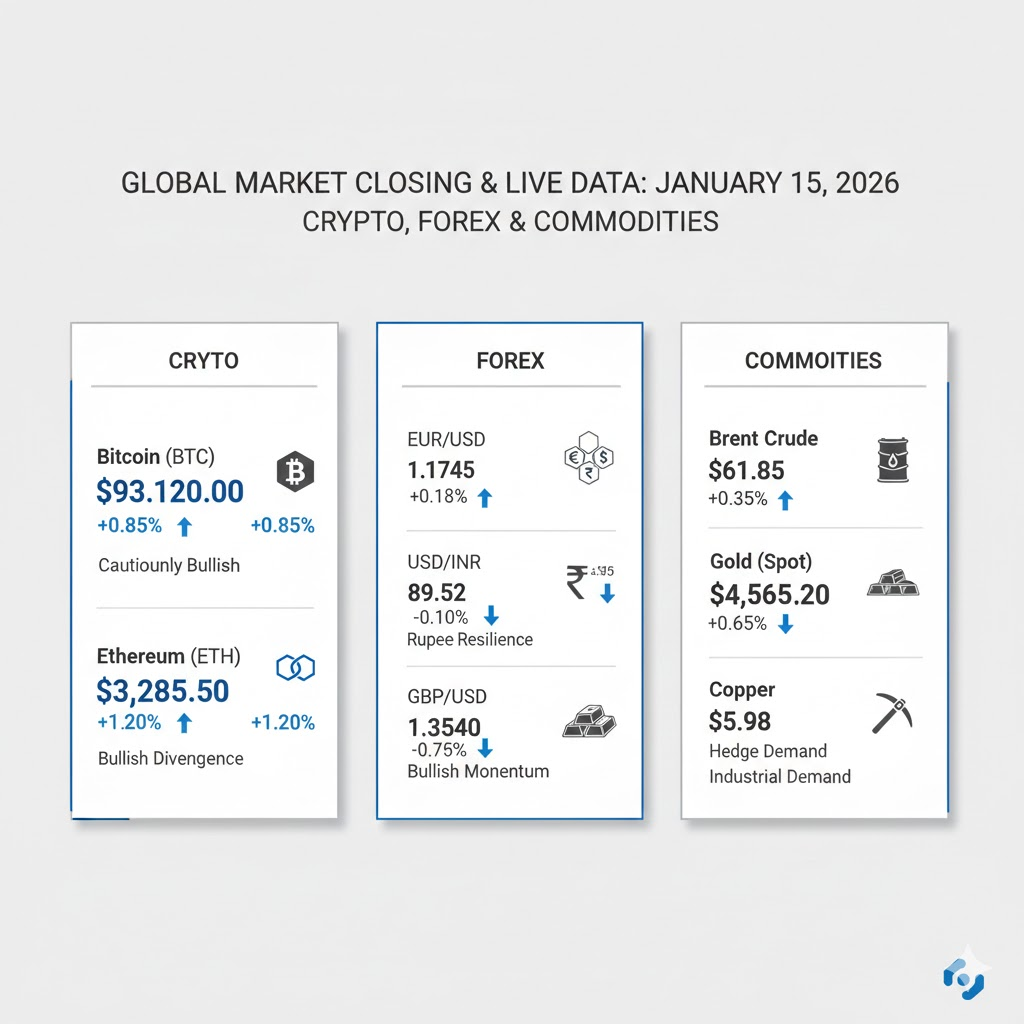
| Asset Class | Instrument | Live Price | % Change | Sentiment |
| Crypto | Bitcoin (BTC) | $93,120.00 | +0.85% | Cautiously Bullish |
| Ethereum (ETH) | $3,285.50 | +1.20% | Bullish Divergence | |
| Forex | EUR/USD | 1.1745 | +0.18% | Dollar Weakness |
| USD/INR | 89.52 | -0.10% | Rupee Resilience | |
| GBP/USD | 1.3540 | +0.15% | Bullish Momentum | |
| Commodities | Brent Crude | $61.85 | +0.35% | Rangebound |
| Gold (Spot) | $4,565.20 | +0.65% | Hedge Demand | |
| Copper | $5.98 | +0.70% | Industrial Demand |
The current market cycle is witnessing a “Global Capital Realignment.” As the U.S. Federal Reserve moves closer to its first rate cut of 2026, the yield advantage of the Dollar is diminishing. This is triggering a “Reverse Carry Trade,” where capital is flowing back into high-growth emerging economies, particularly India and Brazil. The stabilization of crude oil in the $60-$65 range has effectively removed the immediate “inflation shock” risk, allowing manufacturing hubs to focus on productivity rather than cost management.
Technically, the “breadth” of the market is finally improving. While 2025 was dominated by seven mega-cap tech stocks, the early days of 2026 show a “Participation Surge” in mid-caps and cyclicals. This broadening is a healthy indicator of a sustainable bull market. However, the low VIX (Volatility Index) levels suggest a degree of market complacency that often precedes a sharp “price shakeout.” Investors are currently pricing in a perfect “Soft Landing,” leaving little room for error in upcoming economic data.
Lastly, the digital asset ecosystem has decoupled from traditional tech-proxy status. Bitcoin is increasingly behaving as a “Sovereign Reserve Asset” as central banks continue to grapple with fiscal deficits. The institutionalization of crypto through ETFs and corporate treasury allocations has provided a floor that was absent in previous cycles. This suggests that any pullbacks in BTC near the $90k mark will likely be met with aggressive institutional buying rather than retail panic.
North America (NYSE/NASDAQ):
The U.S. session is dominated by the release of Initial Jobless Claims and Retail Sales. Analysts observe a “Goldilocks” trend—hiring is slowing enough to satisfy the Fed but consumption remains high enough to support corporate earnings. Technical Analysis: The S&P 500 is forming a “Bullish Pennant” on the daily chart, targeting 7,100. Fundamental Analysis: Earnings for the banking sector show improved Net Interest Margins, acting as a sector catalyst.
Europe (LSE/DAX/CAC):
European indices are outperforming as energy costs stabilize and industrial production in Germany shows its first month-over-month increase since late 2025. Technical Analysis: The DAX is trading above its 50-day and 200-day Moving Averages, indicating a confirmed long-term uptrend. Fundamental Analysis: The ECB’s cautious dovishness is providing a predictable environment for industrial investment.
Asia (TSE/HKEX/NSE):
The Asian markets are leading the global charge today, with Japan’s Nikkei reaching heights not seen in decades. Technical Analysis: The Nikkei is in a “Parabolic markup phase,” though RSI levels suggest it is extremely overbought. Fundamental Analysis: The shift of manufacturing from China to India and Southeast Asia is providing a structural fundamental floor to regional equity valuations.
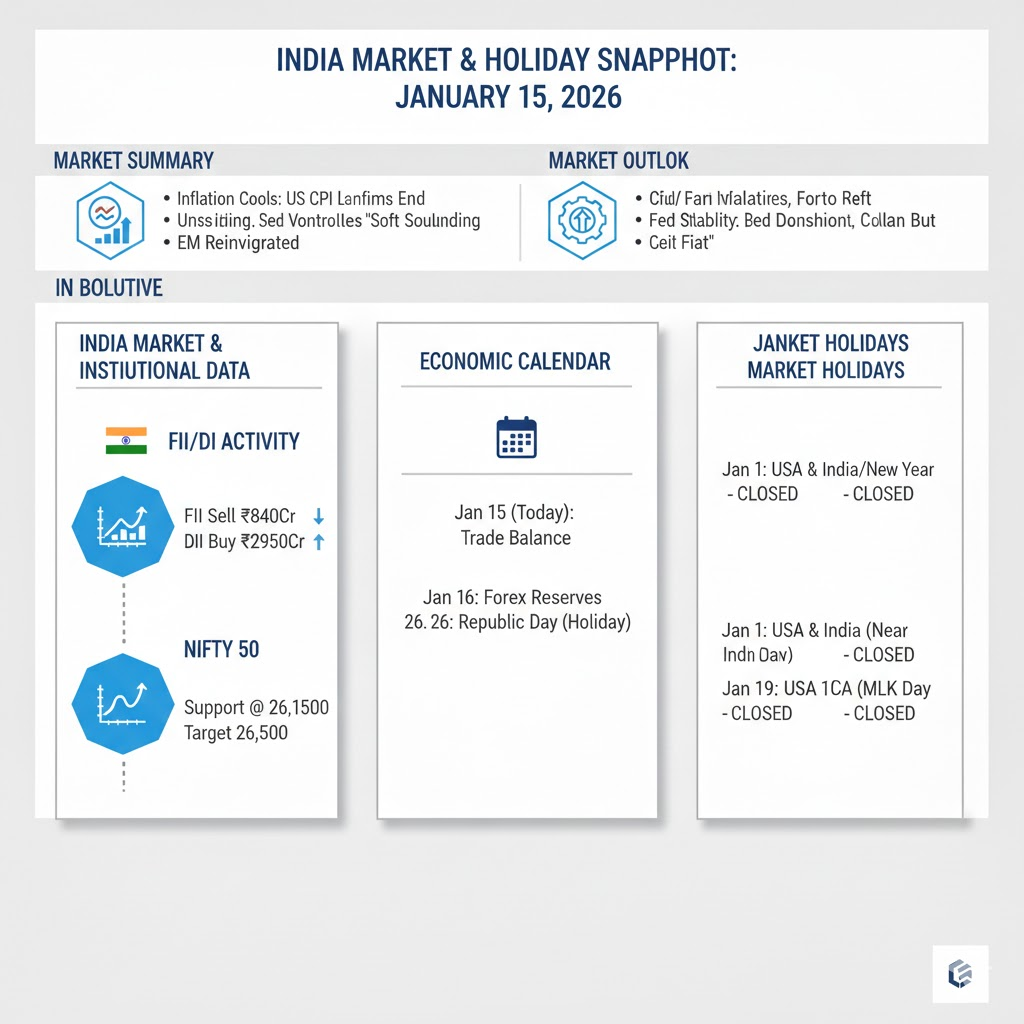
Institutional Activity (Jan 15):
Economic Calendar Highlights:
| Date | Country | Occasion | Market Status |
| Jan 1 | USA & India | New Year’s Day | CLOSED |
| Jan 19 | USA | Martin Luther King Jr. Day | CLOSED |
| Jan 26 | India | Republic Day | CLOSED |
How to View the Global Markets Today:
The market is in a “Confirmation Phase.” We are seeing the physical economy (Industrials/Banking) confirm the gains made by the digital economy (Tech/AI). This is a bullish transition, but it requires a shift in investor focus from “Growth at any price” to “Quality at a reasonable price.”
Risk Management Analysis:
Important Takeaway:
The global market is structurally sound but tactically overextended. Stay invested, but prioritize Liquidity and Diversification. Today’s gains are driven by a weakening Dollar; any sudden reversal in the DXY is your primary exit signal.
aiTrendview Global Disclaimer
This aiTrendview report is an AI-generated document provided exclusively for educational and training purposes and shall not be construed as investment, financial, legal, or tax advice in any jurisdiction.
aiTrendview and its affiliates are not SEBI-registered research analysts, investment advisers, or portfolio managers, and all information herein is automatically compiled from publicly available sources that may contain errors, delays, or omissions.
Users must independently verify all data before making any financial, commercial, or legal decisions, as no market values, performance figures, or trends contained in this report constitute guarantees or forward-looking statements.
Nothing in this publication should be interpreted as a solicitation, recommendation, or endorsement to buy, sell, or hold any security.
aiTrendview, its creators, and all associated AI systems disclaim all liability for losses or consequences arising from the use or reliance upon this content, and users accept full personal responsibility for all actions taken based on it.
Unauthorized reproduction, distribution, or modification of this AI-generated material is strictly prohibited under international copyright, compliance, and intellectual-property laws.


