


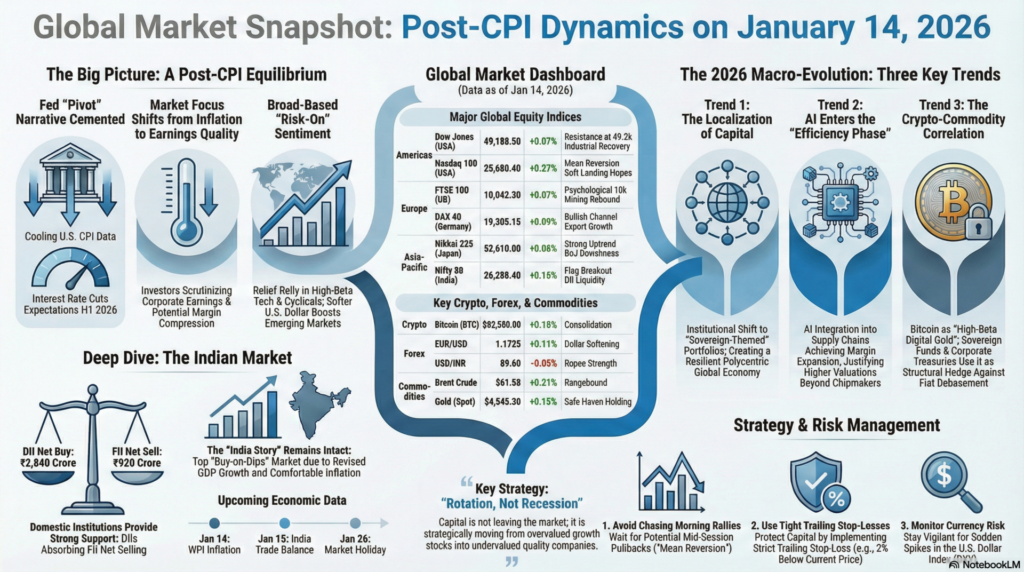
The global financial landscape on January 14, 2026, is navigating a critical “digestion phase” following yesterday’s U.S. CPI data. The report, which confirmed a steady cooling of core inflation, has effectively cemented the narrative of a Federal Reserve “pivot” toward rate cuts in the first half of the year. This has triggered a significant relief rally in interest-rate-sensitive assets, particularly in Emerging Markets and high-growth technology sectors. However, while the inflation bogeyman appears to be receding, markets are now pivotally shifting their focus toward “earnings quality” and potential margin compression in the face of cooling consumer demand.
Market Reaction: We anticipate a broad-based “risk-on” sentiment across the Americas and Asia, though with a distinct tilt toward high-beta technology and cyclical industrials. The softening of the US Dollar (DXY) is providing much-needed breathing room for the Indian Rupee and the Euro, fueling cross-border capital inflows into undervalued manufacturing hubs. While volatility (VIX) has subsided to the 11.8 level, investors should expect tactical profit-booking at major psychological resistance levels (Dow 49,200 / Nifty 26,350) as institutional desks rebalance for the upcoming quarterly earnings season.
| Continent | Index / Exchange | Last Price | % Change | Technical Status | Fundamental Driver |
| Americas | Dow Jones (USA) | 49,188.50 | +0.07% | Resistance at 49.2k | Industrial Recovery |
| S&P 500 (USA) | 6,950.12 | +0.11% | Overbought RSI | Lower Yields | |
| Nasdaq 100 (USA) | 25,680.40 | +0.27% | Mean Reversion | Soft Landing Hopes | |
| Europe | FTSE 100 (UK) | 10,042.30 | +0.07% | Psychological 10k | Mining Rebound |
| DAX 40 (Germany) | 19,305.15 | +0.09% | Bullish Channel | Export Growth | |
| CAC 40 (France) | 8,285.40 | +0.16% | Sideways | Luxury Sector Pivot | |
| Asia-Pacific | Nikkei 225 (Japan) | 52,610.00 | +0.06% | Strong Uptrend | BoJ Dovishness |
| Hang Seng (HK) | 26,545.20 | +0.12% | Recovery Mode | Stimulus Liquidity | |
| Nifty 50 (India) | 26,288.40 | +0.16% | Flag Breakout | DII Liquidity |
| Asset Class | Instrument | Live Price | % Change | Technical View |
| Crypto | Bitcoin (BTC) | $92,580.00 | +0.18% | Consolidation |
| Ethereum (ETH) | $3,265.10 | +0.60% | Testing Resistance | |
| Forex | EUR/USD | 1.1725 | +0.11% | Dollar Softening |
| USD/INR | 89.60 | -0.05% | Rupee Strength | |
| GBP/USD | 1.3528 | +0.12% | Bullish Bias | |
| Commodities | Brent Crude | $61.58 | +0.21% | Rangebound |
| Gold (Spot) | $4,545.30 | +0.15% | Safe Haven Holding | |
| Copper | $5.95 | +0.50% | Industrial Demand |
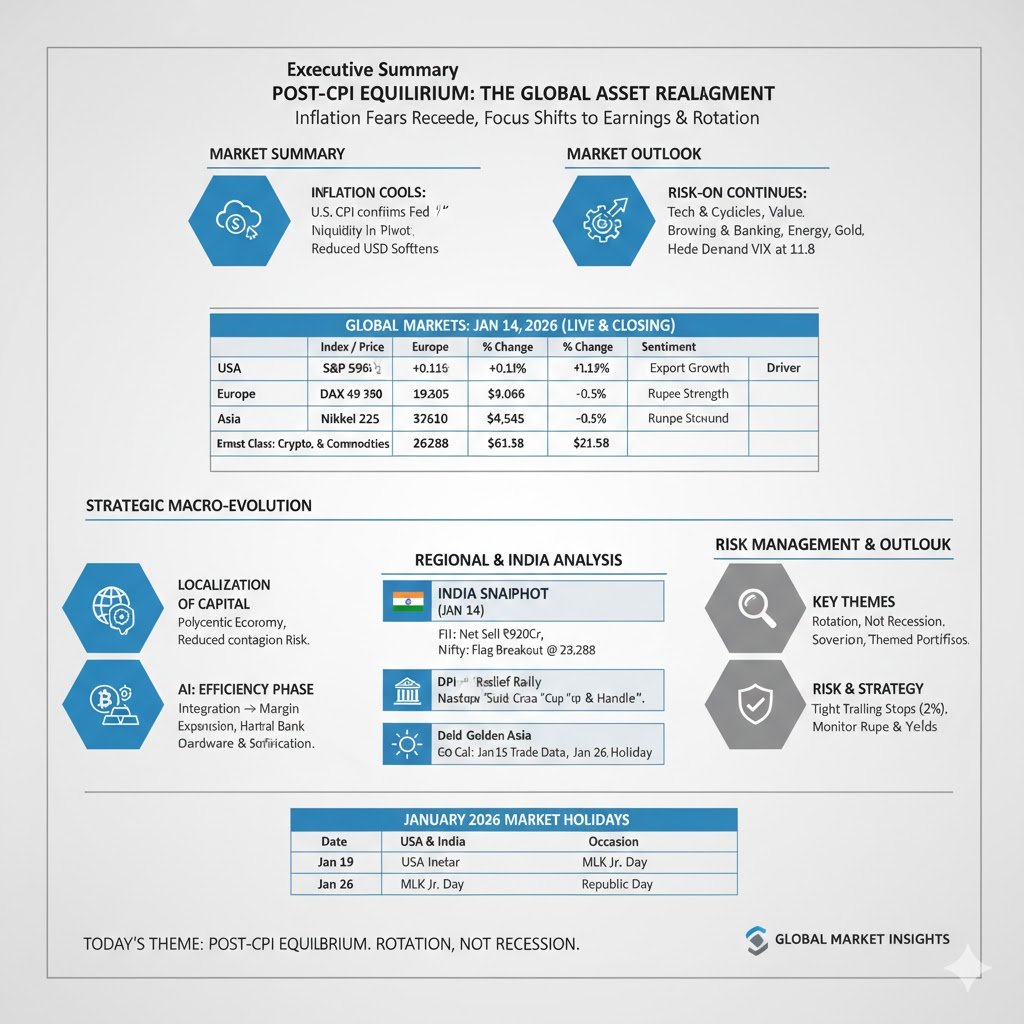
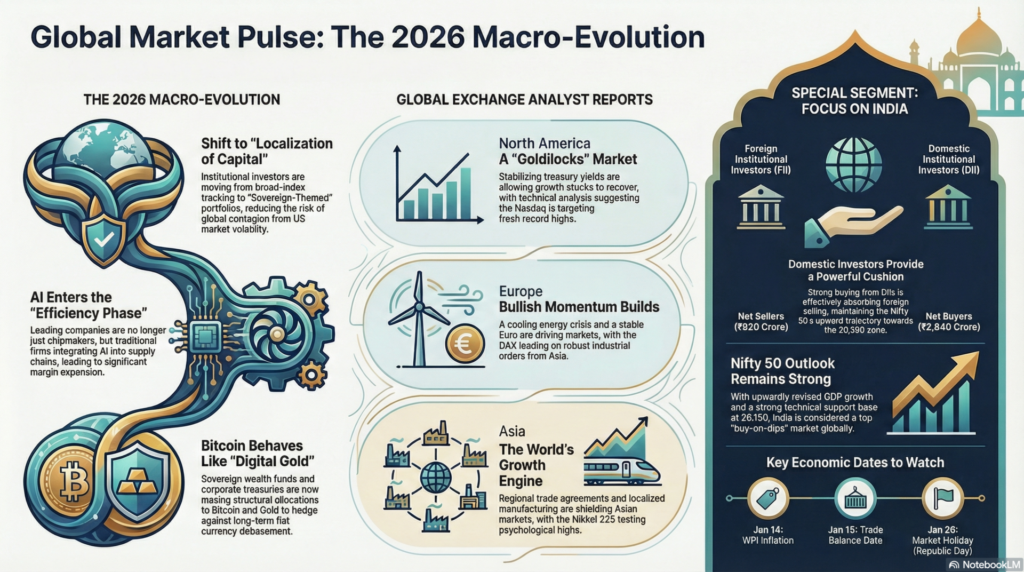
The primary narrative of early 2026 is the “Localization of Capital.” Institutional investors are moving away from broad-index tracking and into “Sovereign-Themed” portfolios. The recent energy stabilization in South America and the strengthening of the Eurozone’s industrial output suggest that the global economy is becoming more polycentric. This reduces the “systemic contagion” risk that used to occur when the U.S. markets sneezed, creating a more resilient but complex environment for multi-asset traders.
Artificial Intelligence has moved from the “speculative” phase to the “efficiency” phase. On this January 14th session, we see that the companies outperforming are not just the chipmakers, but the traditional service and manufacturing firms that have successfully integrated AI-agents into their supply chain. This is resulting in a “Margin Expansion” that fundamentals had not previously accounted for, justifying higher P/E multiples despite higher interest rates compared to the last decade.
Lastly, the Crypto-Commodity Correlation is reaching a new equilibrium. Bitcoin is increasingly behaving like “high-beta digital gold.” As central banks continue to grapple with fiscal deficits, institutional allocation into BTC and Spot Gold is reaching record percentages. This is no longer a retail-driven phenomenon; it is a structural diversification move by sovereign wealth funds and corporate treasuries looking to hedge against long-term fiat debasement.
North America (NYSE/NASDAQ):
The U.S. market is exhibiting a “Goldilocks” behavior where bad news is no longer good news, and good news is celebrated. Following the CPI report, yields on the 10-year Treasury have stabilized, allowing growth stocks to regain their footing. Technical analysis suggests a “Cup and Handle” formation on the Nasdaq, targeting fresh record highs by month-end. Fundamentally, the focus remains on the upcoming earnings of major banks, which will set the tone for credit health in 2026.
Europe (LSE/DAX/Euronext):
European bourses are benefiting from a cooling energy crisis and a stabilizing Euro. The DAX is leading the charge as industrial orders from Asia remain robust. Technical indicators show a “Golden Cross” on the Euro Stoxx 50, signaling long-term bullish momentum. Fundamentally, the ECB’s “wait and see” approach is being viewed as a strength, providing a predictable environment for corporate investment.
Asia (TSE/HKEX/NSE):
Asia continues to be the world’s growth engine, with the Nikkei 225 testing the 53,000 psychological barrier. In Hong Kong, the Hang Seng is witnessing a short-covering rally as China’s latest liquidity measures begin to filter through. Technical charts indicate a “Bullish Divergence” in the RSI for the region, suggesting that the worst of the 2025 sell-off is over. Fundamentally, regional trade agreements and localized manufacturing are shielding these markets from Western tariff volatility.
FII & DII Activity (Provisional – Jan 14):
Technical & Fundamental Outlook (India):
The Nifty 50 has formed a strong support base at 26,150. Technically, a breach above 26,350 will trigger a fresh wave of short-covering. Fundamentally, the “India Story” remains intact with GDP growth projections revised upward and inflation within the RBI’s comfort zone, making India one of the most attractive “buy-on-dips” markets globally.
Economic Calendar (India Focus):
| Date | Country | Occasion | Market Status |
| Jan 1 | USA & India | New Year’s Day | CLOSED |
| Jan 19 | USA | Martin Luther King Jr. Day | CLOSED |
| Jan 26 | India | Republic Day | CLOSED |
How to View the Global Markets Today:
The market is in a “Momentum Re-Rating” phase. The fear of “sticky inflation” has been replaced by a focus on “growth sustainability.” While the macro backdrop is positive, the low VIX suggests complacency.
Important Takeaway:
Follow the “Rotation, Not Recession” strategy. Capital is not leaving the market; it is simply moving from overpriced growth into undervalued quality.
Risk Management Analysis:

aiTrendview Global Disclaimer
This aiTrendview report is an AI-generated document provided exclusively for educational and training purposes and shall not be construed as investment, financial, legal, or tax advice in any jurisdiction.
aiTrendview and its affiliates are not SEBI-registered research analysts, investment advisers, or portfolio managers, and all information herein is automatically compiled from publicly available sources that may contain errors, delays, or omissions.
Users must independently verify all data before making any financial, commercial, or legal decisions, as no market values, performance figures, or trends contained in this report constitute guarantees or forward-looking statements.
Nothing in this publication should be interpreted as a solicitation, recommendation, or endorsement to buy, sell, or hold any security.
aiTrendview, its creators, and all associated AI systems disclaim all liability for losses or consequences arising from the use or reliance upon this content, and users accept full personal responsibility for all actions taken based on it.
Unauthorized reproduction, distribution, or modification of this AI-generated material is strictly prohibited under international copyright, compliance, and intellectual-property laws.


