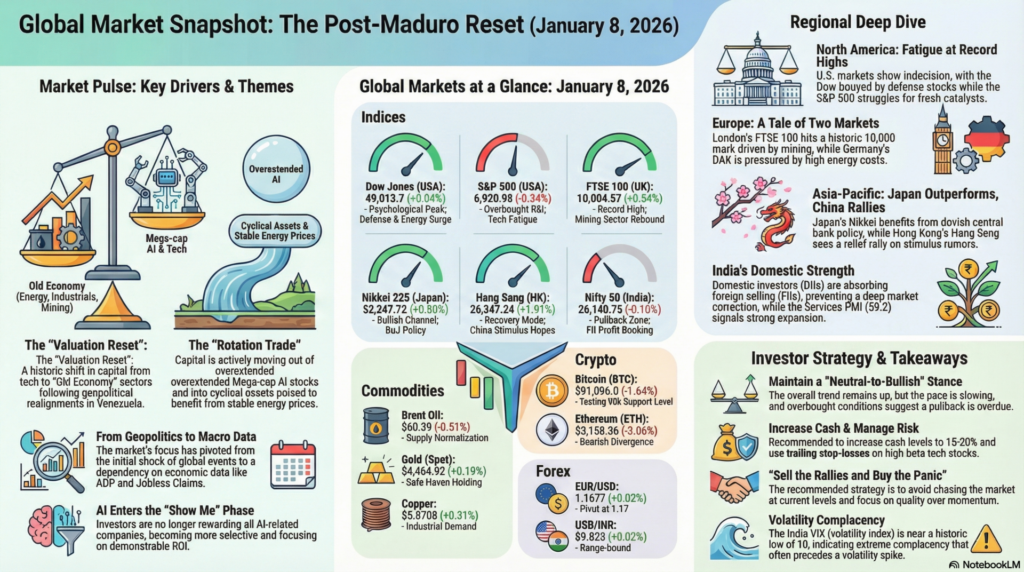
The global financial landscape on January 8, 2026, is navigating a historic “valuation reset” as investors digest the full implications of the U.S. intervention in Venezuela and the resulting shifts in energy supply chains. While the initial shock has subsided, the “Maduro Era” closure has triggered a massive reallocation of capital toward Western-aligned energy infrastructure and defense sectors. U.S. indices, led by the Dow Jones hitting the 49,000 psychological barrier, are exhibiting “valuation fatigue” in tech, while “Old Economy” sectors (Energy, Industrials, Mining) are seeing their strongest inflows in years.
Market Outlook: We anticipate a period of heightened volatility as the market transitions from “Geopolitical Shock” to “Data Dependency.” With the U.S. government shutdown in the rear-view mirror, the focus has shifted sharply to today’s ADP and Jobless Claims data. Expect the US Dollar to remain range-bound with a bearish bias as the Rupee and other emerging market currencies find support from crude oil price stabilization (Brent near $60). A “rotation trade” is in full swing: capital is exiting overextended Mega-cap AI plays and entering cyclical assets that benefit from a lower-inflation environment and stabilized energy costs.
| Continent | Major Exchange / Index | Last Price | % Change | Technical Status | Fundamental Driver |
| Americas | Dow Jones (USA) | 49,013.7 | +0.04% | Psychological Peak | Defense & Energy Surge |
| S&P 500 (USA) | 6,920.95 | -0.34% | Overbought RSI | Tech Valuation Fatigue | |
| Nasdaq 100 (USA) | 25,837.25 | +0.10% | Support at 25,750 | Semiconductor Rotation | |
| Europe | FTSE 100 (UK) | 10,004.57 | +0.54% | Record High | Mining Sector Rebound |
| DAX 40 (Germany) | 19,150.75 | -0.12% | Trend Exhaustion | Manufacturing Slowdown | |
| Asia-Pacific | Nikkei 225 (Japan) | 52,247.72 | +0.80% | Bullish Channel | BoJ Policy Continuity |
| Hang Seng (HK) | 26,347.24 | +1.91% | Recovery Mode | China Stimulus Hopes | |
| Nifty 50 (India) | 26,140.75 | -0.10% | Pullback Zone | FII Profit Booking | |
| Sensex (India) | 84,961.14 | -0.10% | Neutral | Sectoral Rebalancing |
| Asset Class | Instrument | Live Price | % Change | Technical View |
| Crypto | Bitcoin (BTC) | $91,096.0 | -1.64% | Testing 90k Support |
| Ethereum (ETH) | $3,158.36 | -3.06% | Bearish Divergence | |
| Forex | EUR/USD | 1.1677 | +0.02% | Pivot at 1.17 |
| USD/INR | 89.823 | +0.02% | Range-bound | |
| GBP/USD | 1.3457 | -0.01% | Bullish Strength | |
| Commodities | Brent Oil | $60.39 | -0.51% | Supply Normalization |
| Gold (Spot) | $4,464.92 | +0.19% | Safe Haven Holding | |
| Copper | $5.8708 | +0.31% | Industrial Demand |
North America (NYSE/NASDAQ)
U.S. markets are showing signs of “fatigue” at record levels. While the Dow remains buoyed by defense and aerospace stocks following global geopolitical realignments, the S&P 500 and Nasdaq are struggling to find fresh catalysts.
Europe (LSE/DAX/CAC)
London’s FTSE 100 hit the historic 10,000 mark as mining giants (Glencore, Rio Tinto) surged on expectations of improved global trade. In contrast, the DAX remains pressured by high energy costs impacting industrial output.
Asia (TSE/HKEX/NSE)
Japan’s Nikkei continues to outperform as the BoJ maintains a dovish stance relative to Western peers. China’s Hang Seng is seeing a relief rally on rumors of a massive liquidity injection into the property sector.
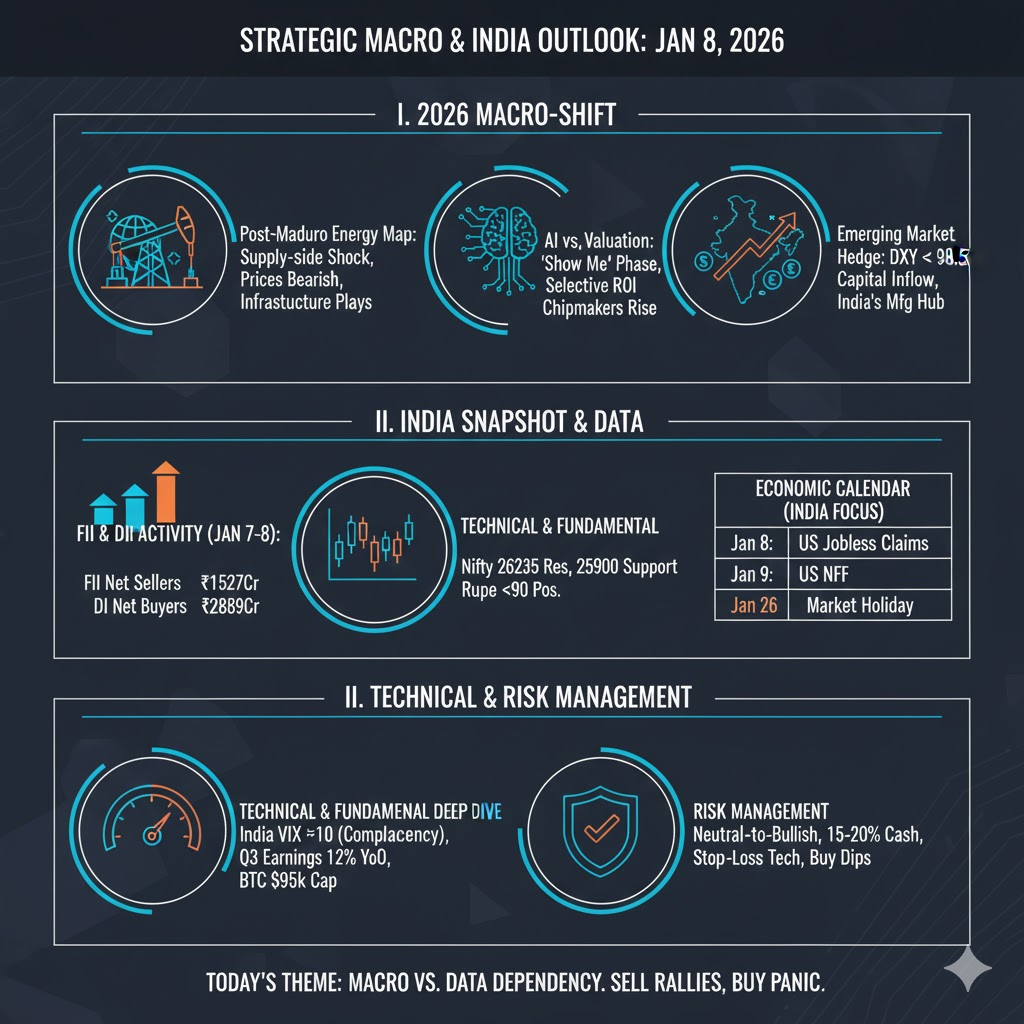
1. The “Post-Maduro” Energy Map: The capture of the Venezuelan leadership has led to a “supply-side shock” that is actually bearish for prices in the long term. Major oil firms are already filing for exploration licenses in the Orinoco belt. This is causing a re-rating of global energy stocks from “scarcity plays” to “infrastructure plays.”
2. AI Productivity vs. Valuation: We are entering the “Show Me” phase of AI. Markets are no longer rewarding companies just for mentioning “GenAI.” The divergence seen in the Nasdaq today—where chipmakers like NVIDIA are rising while software firms are falling—suggests that capital is becoming much more selective about ROI on AI investments.
3. The Emerging Market Hedge: As the U.S. Dollar Index (DXY) stabilizes around 98.50, capital is flowing back into Emerging Markets. India and South Korea are the primary beneficiaries. The “India Story” is shifting from purely domestic consumption to a “Global Manufacturing Hub,” supported by a strengthening Rupee and fiscal discipline.
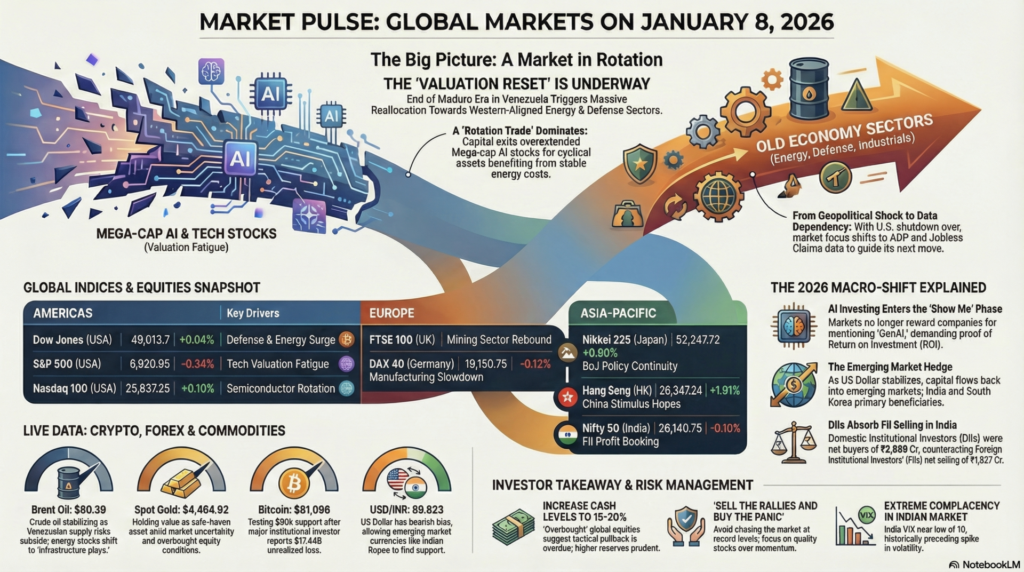
FII & DII Activity (Provisional – Jan 7-8)
Economic Calendar (India Focus)
| Date | Event | Expected Impact |
| Jan 8 | US Jobless Claims (India IT impact) | High |
| Jan 9 | US Non-Farm Payrolls (NFP) | Very High |
| Jan 26| Republic Day (Market Holiday) | Closed |
Risk Management:
Investors should maintain a “Neutral-to-Bullish” stance but increase cash levels to 15-20%. The “Overbought” conditions in global equities suggest that a tactical pullback is overdue. Use trailing stop-losses on high-beta tech stocks and look to accumulate “defensives” like Gold or FMCG during dips.
Today’s Important Takeaway:
The market is shifting from “Geopolitics” back to “Macro.” Today’s US Jobless claims will decide if the rally continues or if we enter a “consolidation week.”
Global Market View:
The trend remains up, but the pace is slowing. Do not chase the market at these levels. The best strategy today is to “Sell the Rallies and Buy the Panic.” Focus on quality over momentum as we approach the Q1 earnings season.
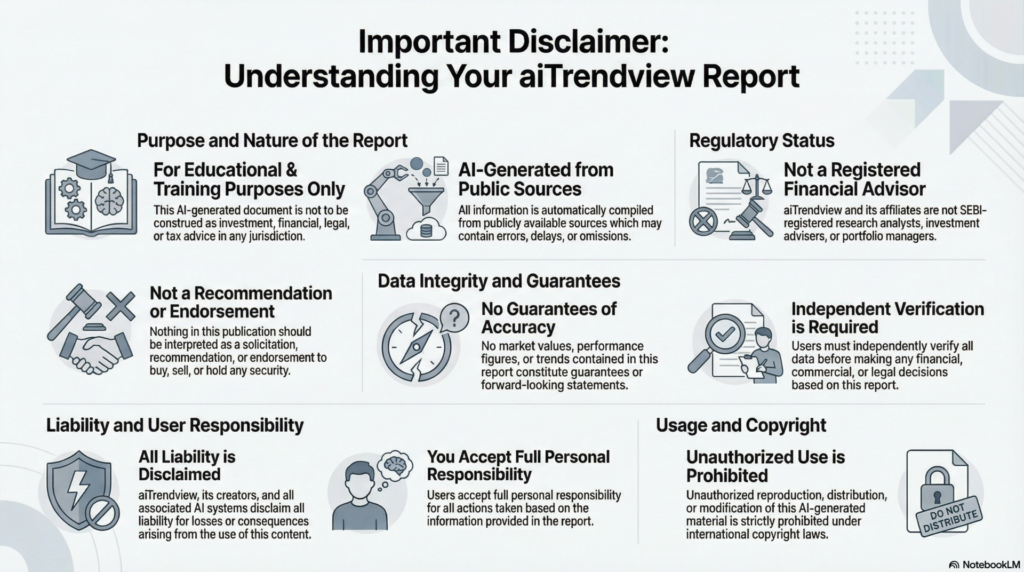
aiTrendview Global Disclaimer
This aiTrendview report is an AI-generated document provided exclusively for educational and training purposes and shall not be construed as investment, financial, legal, or tax advice in any jurisdiction.
aiTrendview and its affiliates are not SEBI-registered research analysts, investment advisers, or portfolio managers, and all information herein is automatically compiled from publicly available sources that may contain errors, delays, or omissions.
Users must independently verify all data before making any financial, commercial, or legal decisions, as no market values, performance figures, or trends contained in this report constitute guarantees or forward-looking statements.
Nothing in this publication should be interpreted as a solicitation, recommendation, or endorsement to buy, sell, or hold any security.
aiTrendview, its creators, and all associated AI systems disclaim all liability for losses or consequences arising from the use or reliance upon this content, and users accept full personal responsibility for all actions taken based on it.
Unauthorized reproduction, distribution, or modification of this AI-generated material is strictly prohibited under international copyright, compliance, and intellectual-property laws.