Global Markets Strategic Outlook: Digital Assets and Precious Metals (January 2026)
1. Executive Summary: The Great Bifurcation of 2026
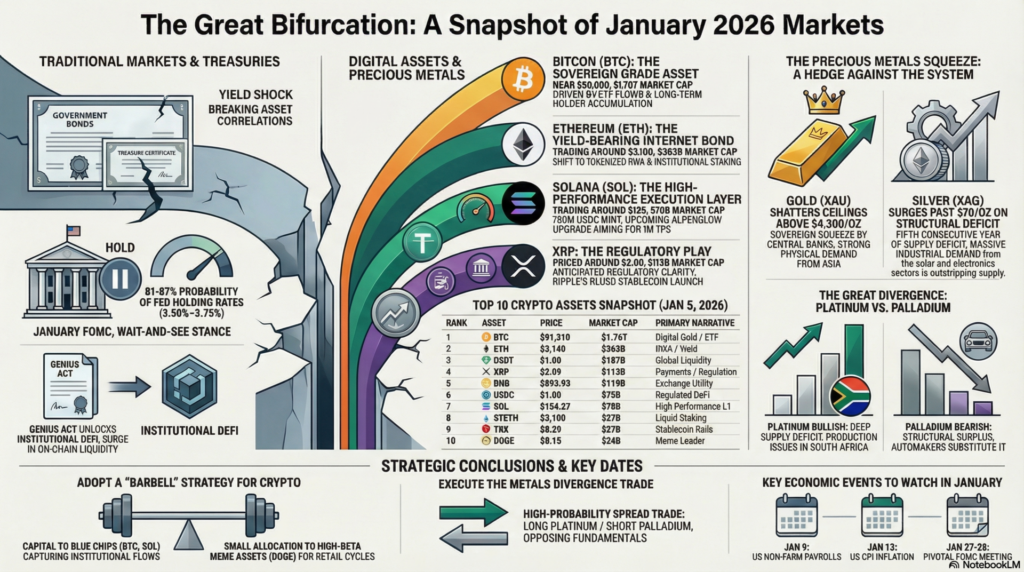
As global financial markets reawaken from the holiday slumber on January 5, 2026, investors are confronted with a complex and divergent landscape. The opening trading sessions of the new year have been defined by a stark dichotomy: a “yield shock” in traditional sovereign treasury markets contrasting sharply with a resilient, accumulation-heavy consolidation in the digital asset sector.1 The narrative of 2026 is already shaping up to be one of “The Great Bifurcation,” where asset correlations break down under the weight of shifting monetary policy, regulatory breakthroughs, and physical supply constraints.
The total cryptocurrency market capitalization stands at approximately $3.12 trillion, reflecting a maturation of the asset class driven by the “Trump Trade” dynamics and the continued integration of spot ETFs.2 While Bitcoin (BTC) trades in a tightened range near $88,000–$91,000, signaling a potential breakout driven by institutional adoption, the broader market is being reshaped by the implementation of the Guiding and Establishing National Innovation for U.S. Stablecoins (GENIUS) Act.4 This legislative milestone has already triggered significant on-chain liquidity events, most notably Circle’s minting of 750 million USDC on the Solana network in the first days of the year.5
Simultaneously, the commodities sector is witnessing a historic decoupling. Gold has shattered psychological ceilings, trading comfortably above $4,300 per ounce, driven by a “sovereign squeeze” as central banks corner supply.6 Silver has surged past $70, propelled by a fifth consecutive year of structural deficits.8 However, the most nuanced story lies in the Platinum Group Metals (PGMs), where Platinum faces a supply crunch and price appreciation, while Palladium grapples with surpluses due to the automotive sector’s transition away from catalytic converters.9
This report provides an exhaustive, expert-level analysis of the Top 20 Cryptocurrencies and the Major 4 Precious Metals for January 2026. By synthesizing live market data, on-chain metrics, technical chart patterns, and upcoming economic announcements, we offer a comprehensive roadmap for institutional and sophisticated investors navigating this pivot point in the global economy.
2. The Macroeconomic Environment: Policy, Yields, and the “Wait-and-See” Fed
2.1 The Federal Reserve: Navigating the January 2026 Pivot
The monetary policy landscape in January 2026 is defined by a palpable tension between the Federal Reserve’s desire to support a softening labor market and the necessity to contain lingering inflationary pressures stemming from fiscal expansion and tariffs. Following a cumulative 75 basis point reduction cycle throughout 2025, bringing the federal funds rate to a target range of 3.50%–3.75%, the central bank has adopted a cautious “wait-and-see” stance.11
Market probabilities derived from the CME FedWatch Tool indicate a decisive consensus for the upcoming Federal Open Market Committee (FOMC) meeting scheduled for January 27-28, 2026. The data suggests an overwhelming probability—ranging between 81.4% and 86.7%—that the Fed will hold rates steady, with only a minority expectation (approximately 13-18%) of a further 25 basis point cut.13
Table 1: Implied Fed Rate Probabilities (January 2026 Meeting)
| Meeting Date | Scenario: Hold (3.50-3.75%) | Scenario: Cut 25bps (3.25-3.50%) | Market Sentiment |
| Jan 27-28, 2026 | ~81.4% – 86.7% | ~13.3% – 18.6% | Hawkish Hold |
| Mar 18, 2026 | ~54.4% | ~40.7% | Data Dependent |
| Jun 17, 2026 | ~17.1% | ~41.2% | Easing Resumes |
Source: Consolidated analysis of CME FedWatch data and analyst forecasts.13
This hesitation stems from a resilient, albeit softening, labor market—with unemployment hovering near 4.6%—and the inflationary implications of the administration’s trade policies.16 The “Yield Shock” observed in the first week of January, characterized by a sell-off in US Treasurys, reflects the market pricing in a “higher-for-longer” terminal rate environment.1 This environment traditionally creates headwinds for non-yielding assets; however, the continued ascent of Gold and Bitcoin suggests that counter-party risk and debasement fears are currently outweighing yield opportunity costs.
2.2 The GENIUS Act: The Structural Foundation of 2026
The most significant structural shift in the digital asset market for 2026 is the implementation of the Guiding and Establishing National Innovation for U.S. Stablecoins (GENIUS) Act. Signed into law in July 2025, its regulatory framework is actively reshaping market structure in early 2026.4
The Act establishes a comprehensive federal floor for payment stablecoins, mandating 1:1 reserve backing with high-quality liquid assets (cash or short-term Treasurys) and strictly prohibiting the issuance of algorithmic stablecoins that lack such collateral. Crucially, it allows state-qualified issuers to operate under federal standards if they meet solvency requirements, effectively integrating stablecoins into the regulated banking system.19
The impact of this legislation cannot be overstated. It has removed the “regulatory fog” that previously prevented major US banks and institutional treasuries from interacting with stablecoins. Institutions are now legally empowered to utilize stablecoins for real-time gross settlement (RTGS) and cross-border treasury management.20 This has led to a surge in on-chain liquidity, as evidenced by Circle’s strategic move to mint 750 million USDC on Solana in early January, a direct response to the demand for high-velocity, compliant settlement layers.5
3. Cryptocurrency Market Analysis: The Majors
The digital asset market in January 2026 is characterized by “sectoral rotation” and a flight to quality. While Bitcoin acts as the index anchor, smart contract platforms (Ethereum, Solana) and specific utility tokens (XRP) are decoupling based on idiosyncratic drivers like ETF flows, technological upgrades, and regulatory clarity.
3.1 Bitcoin (BTC): The Sovereign Grade Asset
Price: ~$88,485 – $91,335 | Market Cap: ~$1.76 Trillion 2
Fundamental Analysis:
Bitcoin’s performance in early 2026 is defined by “ascending consolidation.” Despite a 5% correction in 2025 from its October peak of $126,300, the asset has established a robust support floor between $82,000 and $84,000.3 The primary driver remains the supply-demand imbalance exacerbated by the continuing impact of the 2024 halving and the maturation of Spot Bitcoin ETFs.
A key development in 2026 is the shift in institutional behavior from pure directional speculation to yield generation. The exponential growth of covered call strategies in the options market suggests that institutions are now comfortable holding BTC as a collateral asset while harvesting volatility premiums.22 This dampens upside volatility but creates a massive floor of support. Furthermore, on-chain data reveals that the 30-day change in long-term holder supply has turned positive (+10,700 BTC) for the first time in months. This indicates that “whales” are accumulating during this consolidation phase rather than distributing, signaling underlying strength despite the choppy price action.22
Technical Analysis:
3.2 Ethereum (ETH): The Yield-Bearing Internet Bond
Price: ~$3,008 – $3,140 | Market Cap: ~$363 Billion 21
Fundamental Analysis:
Ethereum enters 2026 with a renewed narrative focus on “Real World Assets” (RWA) and institutional staking. The narrative has shifted from ETH merely being “ultrasound money” to being the primary settlement layer for tokenized financial assets. BlackRock’s iShares Staked Ethereum Trust filing has been a catalyst, introducing the prospect of yield-bearing ETFs which could lock up significant percentages of the circulating supply, further reducing liquid float.26
Technologically, the network is preparing for the “Lean Ethereum” roadmap in 2026, focusing on L1 optimization and quantum resistance, following the “Fusaka” upgrade in late 2025 which improved Layer-2 data availability.26 However, challenges remain. ETH has underperformed Solana in transaction volume, processing $44 billion versus Solana’s $101 billion in DEX volume over the last 30 days, highlighting the intense competition for execution layer dominance.27
Technical Analysis:
3.3 Solana (SOL): The High-Performance Execution Layer
Price: ~$125 – $136 | Market Cap: ~$70 Billion 30
Fundamental Analysis:
Solana is arguably the most momentum-driven asset of Q1 2026. The network has successfully courted major stablecoin liquidity, evidenced by Circle’s 750 million USDC mint in early January.5 This liquidity injection is critical as it deepens order books for DeFi protocols and reduces slippage for institutional-sized trades, reinforcing Solana’s value proposition for high-frequency finance.
The looming “Alpenglow” upgrade (expected Q1 2026) is a massive fundamental catalyst. This upgrade replaces the current consensus mechanism with a more robust version, potentially increasing finality speed to 100-150 milliseconds. Furthermore, the integration with the “Firedancer” validator client is viewed as the “holy grail” for Solana scaling, theoretically enabling 1 million TPS. If successful, this would cement Solana as the only chain capable of handling global stock market throughput, driving the “Solana ETF” narrative which has already seen assets surpass $1 billion.27
Technical Analysis:
3.4 XRP: The Regulatory Play
Price: ~$1.87 – $2.09 | Market Cap: ~$113 Billion 21
Fundamental Analysis:
XRP has exhibited significant relative strength, up approximately 4-6% in the opening days of 2026. The primary driver is the anticipated launch of Ripple’s RLUSD stablecoin and the favorable regulatory environment under the new administration. The market is pricing in a “friendly” SEC that may finally resolve long-standing litigation uncertainties, allowing XRP to be fully integrated into US banking rails via the GENIUS Act framework.32
Technical Analysis:
3.5 Binance Coin (BNB): The Exchange Utility
Price: ~$863 – $893 | Market Cap: ~$119 Billion 21
Fundamental Analysis:
BNB continues to function as a deflationary asset driven by the Binance ecosystem’s burn mechanisms. It remains the fourth-largest crypto asset (excluding stablecoins) and serves as a key liquidity hub for the BSC ecosystem. While less volatile than SOL or XRP, it offers stability and utility within the world’s largest exchange environment.
Technical Analysis:
4. The Top 20 Altcoin Matrix: Analysis of the Wider Market
Beyond the top 5, the crypto market displays a mix of stablecoin dominance and sector-specific speculative fervor. The following analysis covers the remaining assets in the top 20 by market capitalization.
4.1 Stablecoins: The Liquidity Backbone (USDT, USDC, USDS)
4.2 The Meme Supercycle: Dogecoin (DOGE) & Shiba Inu (SHIB)
4.3 The Smart Contract Challengers: Cardano (ADA), TRON (TRX), & Avalanche (AVAX)
4.4 The DeFi & Infrastructure Plays: LINK, STETH, & Wrapped Assets
4.5 The New Entrants & Outliers
Table 2: Top 20 Crypto Asset Snapshot (Jan 5, 2026)
| Rank | Asset | Price | 24h Change | Market Cap | Primary Narrative |
| 1 | BTC | $91,310 | +0.77% | $1.76T | Digital Gold / ETF |
| 2 | ETH | $3,140 | +0.56% | $363B | RWA / Yield |
| 3 | USDT | $1.00 | +0.01% | $187B | Liquidity |
| 4 | XRP | $2.09 | +3.48% | $113B | Payments / Regs |
| 5 | BNB | $893.93 | +1.67% | $119B | Exchange |
| 6 | USDC | $1.00 | 0.00% | $75B | Regulated DeFi |
| 7 | SOL | $134.27 | +0.62% | $70B | High Perf L1 |
| 8 | STETH | $3,100 | +1.36% | $27B | Liquid Staking |
| 9 | TRX | $0.29 | +1.25% | $27B | Stablecoin Rails |
| 10 | DOGE | $0.15 | +4.23% | $24B | Meme Leader |
| 11 | ADA | $0.39 | +5.86% | $14B | L1 Alternative |
| 12 | BCH | $630 | +5.75% | $12.6B | Payments |
| 13 | WSTETH | $3,800 | +1.34% | $12.2B | DeFi Comp. |
| 14 | WBTC | $89,600 | +0.03% | $11.2B | BTC on ETH |
| 15 | WBETH | $3,370 | +1.30% | $11B | Binance Staking |
| 16 | USDS | $1.00 | +0.01% | $9.6B | Sky/Maker |
| 17 | WEETH | $3,370 | +1.44% | $9.6B | Restaking |
| 18 | LINK | $13.12 | +0.61% | $9.3B | Oracles/RWA |
| 19 | BSC-USD | $1.00 | +0.11% | $8.9B | BSC Liquidity |
| 20 | LEO | $9.22 | -4.26% | $8.5B | Exchange Utility |
Source: Consolidated pricing data from Forbes and CoinDCX.25
5. Precious Metals Market Analysis: The Sovereign Squeeze
The precious metals complex in 2026 is defined by a “sovereign squeeze.” Central banks and sovereigns are cornering supply, driving a decoupling of prices from traditional paper market mechanics. This is not a standard inflation hedge; it is a hedge against the architecture of the financial system itself.
5.1 Gold (XAU): The Unshakable Sovereign
Price: ~$4,350 – $4,409/oz | Trend: Strong Bullish 6
Fundamental Analysis:
Gold is trading at historic highs, comfortably breaching the $4,350 level. The rally is fueled by “debasement hedging.” With US debt exceeding $38 trillion, institutional investors are viewing Gold as the only neutral reserve asset.38
A critical anomaly in 2026 is the pricing structure in Asia; Gold is trading at a premium to spot in China and India, despite record high prices. Typically, high prices dampen physical demand in these price-sensitive markets, but the current premium indicates panic buying or a structural shift in wealth preservation strategies in the East.7
Technical Analysis:
5.2 Silver (XAG): The Industrial Powerhouse
Price: ~$73.00 – $76.67/oz 6
Fundamental Analysis:
Silver is outperforming Gold in percentage terms (up ~4% daily in early Jan). The driver is the “fifth consecutive year of structural deficit.” Industrial demand from the photovoltaics (solar) sector and electronics continues to outstrip mining supply.8
The Gold-to-Silver ratio is tightening, currently around 59:1. Historically, this ratio suggests Silver is undervalued relative to Gold and has significant room to run to catch up to Gold’s historic repricing.41
Technical Analysis:
5.3 Platinum & Palladium: The Great Divergence
Platinum Price: ~$1,662 – $1,689/oz | Palladium Price: ~$1,150 – $1,350 (Forecast) 6
The Platinum Group Metals (PGMs) are experiencing a “Great Divergence” driven by supply constraints and substitution effects in the automotive industry.
Table 3: Precious Metals Technical Snapshot (Jan 5, 2026)
| Metal | Spot Price | 24h Change | Technical Stance | Primary Driver |
| Gold | $4,387 | +1.31% | Strong Buy | Central Bank Buying / Debt Fears 7 |
| Silver | $75.05 | +3.14% | Buy (Volatile) | Solar Demand / 5yr Deficit 7 |
| Platinum | $1,671 | +3.28% | Accumulate | Supply Shocks / SA Production 7 |
| Palladium | $1,671* | +3.28% | Sell Rallies | Structural Surplus / Substitution 10 |
| (Note: Palladium spot price spiked short-term in Jan 7, but long-term forecasts remain bearish due to surpluses.10) |
6. Economic Calendar: The Month Ahead
The immediate volatility for both crypto and metals will be dictated by the following economic releases. The “Yield Shock” narrative will be tested by the NFP and CPI data.
7. Strategic Conclusions
1. The “Barbell” Strategy for Crypto:
Investors should avoid the “mushy middle” of the crypto market. The optimal strategy for Q1 2026 is a barbell approach: allocate the majority of capital to high-conviction “Blue Chips” (BTC, SOL, XRP) that capture institutional flows and regulatory clarity, while reserving a small, risk-managed allocation for high-beta “meme” assets (DOGE, PEPE) to capture retail liquidity cycles. Mid-cap utility tokens with low volume and no clear narrative are likely to bleed value against Bitcoin.21
2. The Metals Divergence Trade:
The spread trade of the year is Long Platinum / Short Palladium. The fundamental supply/demand mismatch—Platinum’s deficit vs. Palladium’s surplus—makes this a high-probability mean reversion play. Investors should also maintain core positions in physical Gold and Silver as hedges against fiscal dominance and monetary debasement.10
3. Infrastructure is the New Alpha:
The implementation of the GENIUS Act means the real alpha in 2026 will come from identifying the infrastructure rails that banks and fintechs use for stablecoin settlement. Solana is the current frontrunner for this infrastructure layer, as evidenced by the Circle mint. Watching on-chain stablecoin velocity will be a key leading indicator for asset prices in 2026.5
4. Watch the “Yield Shock”:
If the 10-year Treasury yield continues to spike aggressively in January, it could trigger a short-term correction in both crypto and gold. However, given the strong buying support at lower levels for both assets, any such correction should be viewed as a buying opportunity within a secular bull market.
aiTrendview Global Disclaimer
This aiTrendview report is an AI-generated document provided exclusively for educational and training purposes and shall not be construed as investment, financial, legal, or tax advice in any jurisdiction.
aiTrendview and its affiliates are not SEBI-registered research analysts, investment advisers, or portfolio managers, and all information herein is automatically compiled from publicly available sources that may contain errors, delays, or omissions.
Users must independently verify all data before making any financial, commercial, or legal decisions, as no market values, performance figures, or trends contained in this report constitute guarantees or forward-looking statements.
Nothing in this publication should be interpreted as a solicitation, recommendation, or endorsement to buy, sell, or hold any security.
aiTrendview, its creators, and all associated AI systems disclaim all liability for losses or consequences arising from the use or reliance upon this content, and users accept full personal responsibility for all actions taken based on it.
Unauthorized reproduction, distribution, or modification of this AI-generated material is strictly prohibited under international copyright, compliance, and intellectual-property laws.