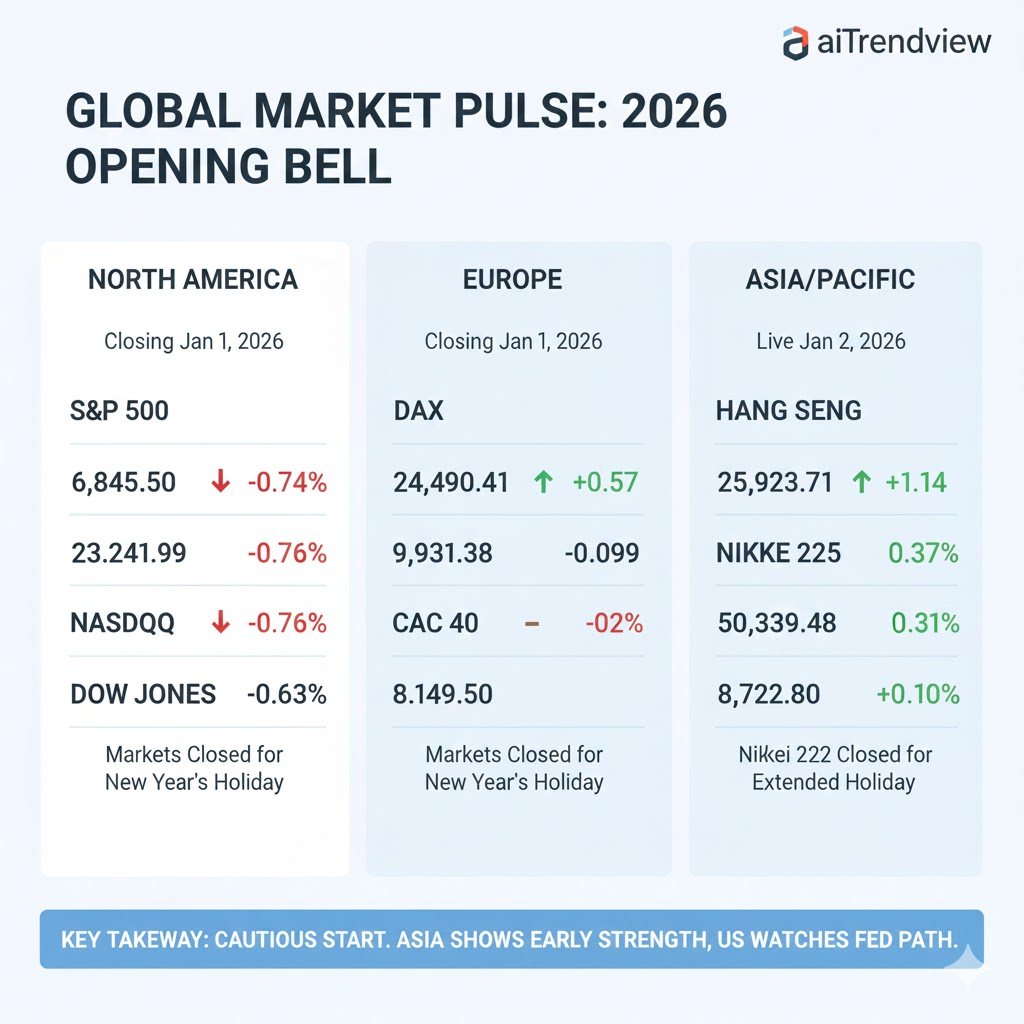
The financial world ushered in January 1, 2026, with a stark divergence between East and West. While major exchanges in the US, UK, Europe, and Asia remained closed for the New Year holiday, Indian markets stood as a global outlier, commencing the first trading session of the year with resilience. This opening session marks a critical transition into a year defined by uneven monetary policy and the deepening of the AI supercycle.

Note: Most global indices reflect closing data from Dec 31, 2025, due to exchange holidays on Jan 1, 2026.
| Region | Index | Value | Change (%) | Status / Context |
| Americas | S&P 500 (USA) | 6,845.50 | -0.74% | Closed; annual gain of ~17.5% in 2025 |
| Dow Jones (USA) | 48,063.29 | -0.63% | Closed; finished 2025 up over 14% | |
| Nasdaq (USA) | 23,241.99 | -0.76% | Closed; 2025 tech leader with 21% gain | |
| Europe | DAX (Germany) | 24,490.41 | +0.57% | Closed; strong 2025 finish |
| FTSE 100 (UK) | 9,931.38 | -0.09% | Closed; steady year-end | |
| CAC 40 (France) | 8,149.5 | -0.23% | Closed | |
| Asia/Pac | Nikkei 225 (Japan) | 50,339.48 | -0.37% | Closed; massive 25% gain in 2025 |
| Hang Seng (HK) | 25,923.71 | +1.14% | Closed; climbed nearly 30% in 2025 | |
| ASX 200 (AUS) | 8,722.8 | +0.10% | Closed |
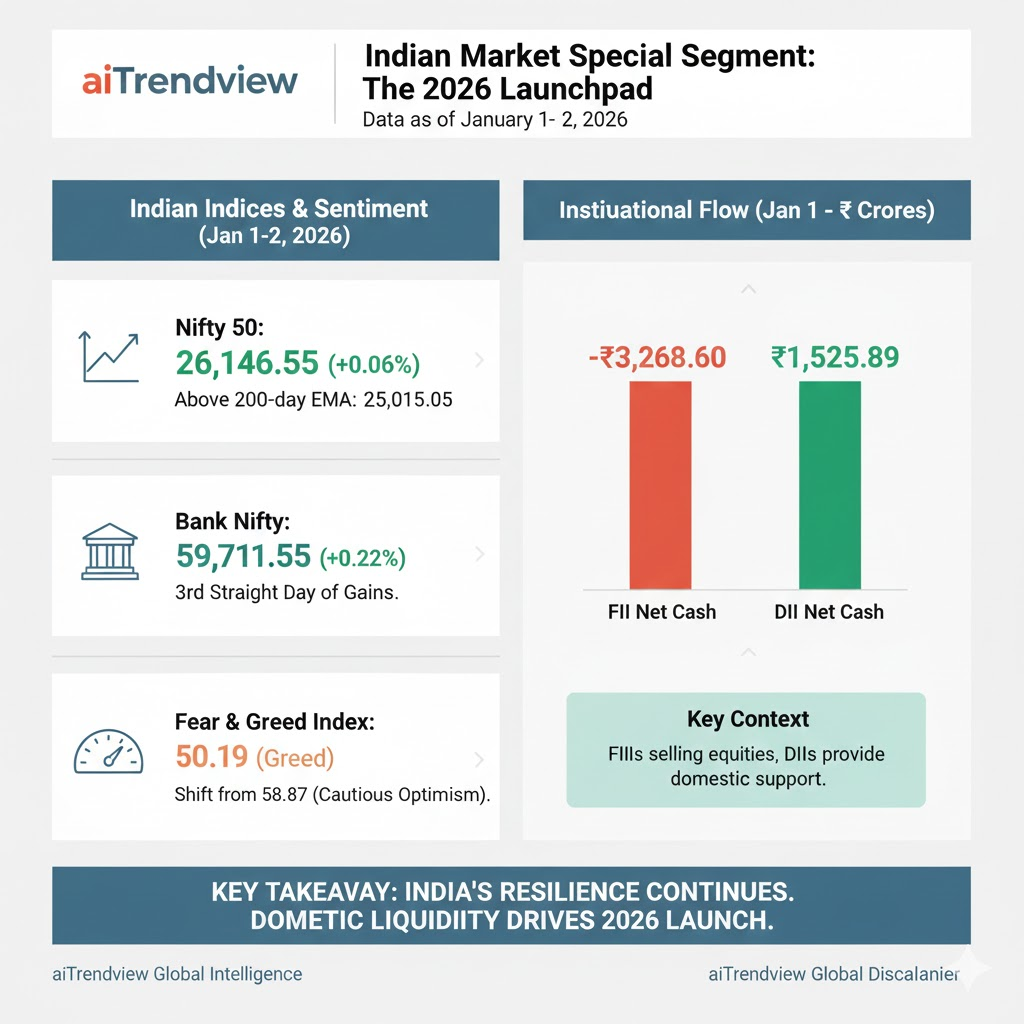
While global peers celebrated, Indian exchanges were open, with the GIFT Nifty rising 0.14% early morning to signal a positive start for the main indices.
| Category | Net Value (Cash) | Weekly Trend |
| FII (Foreign) | -3,268.60 | Aggressive selling totaling -₹13,787.5 over the last week |
| DII (Domestic) | +1,525.89 | Consistent buying with ₹18,861.7 accumulated this week |

| Asset Class | Instrument | Live/Latest Price | Status / News |
| Crypto | Bitcoin (BTC) | $88,412.50 | Reached an all-time high of ₹1.11 crore in late 2025 |
| Forex | USD/INR | 89.93 | Rupee weakened 10 paise on Jan 1 |
| DXY (Dollar Index) | 98.28 | Sharpest annual fall in 8 years during 2025 | |
| Commodities | Gold (Spot) | $4,522.40 | Precious metals saw 31% annual growth in 2025 |
| WTI Crude | $57.25 | Steadiest start to 2026 after 2020-style volatility |
| Date | Event | Expected/Significance |
| Jan 2 | US Initial Jobless Claims | Real-time pulse of US labor health |
| Jan 9 | US Nonfarm Payrolls | Forecast: 64K; crucial for Fed rate decisions |
| Jan 19 | China Q4 GDP (YoY) | Forecast: 4.8%; vital for global demand signals |
| Jan 26 | Republic Day (India) | Market Holiday |
| Jan 27 | Fed Interest Rate Decision | Current target: 3.75% |

This aiTrendview report is an AI-generated document provided exclusively for educational and training purposes and shall not be construed as investment, financial, legal, or tax advice in any jurisdiction.
aiTrendview and its affiliates are not SEBI-registered research analysts, investment advisers, or portfolio managers, and all information herein is automatically compiled from publicly available sources that may contain errors, delays, or omissions.
Users must independently verify all data before making any financial, commercial, or legal decisions, as no market values, performance figures, or trends contained in this report constitute guarantees or forward-looking statements.
Nothing in this publication should be interpreted as a solicitation, recommendation, or endorsement to buy, sell, or hold any security.
aiTrendview, its creators, and all associated AI systems disclaim all liability for losses or consequences arising from the use or reliance upon this content, and users accept full personal responsibility for all actions taken based on it.
Unauthorized reproduction, distribution, or modification of this AI-generated material is strictly prohibited under international copyright, compliance, and intellectual-property laws.