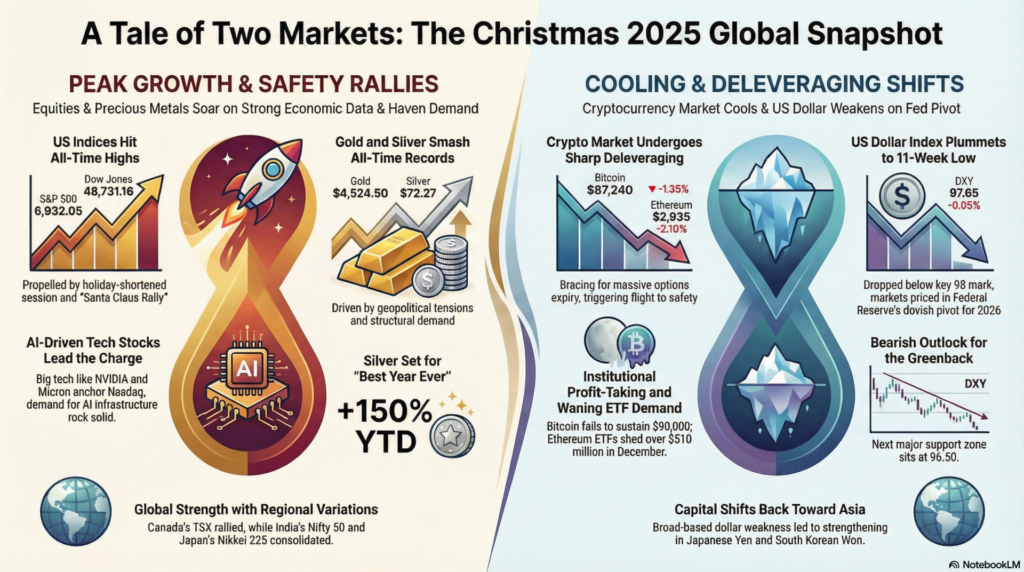
The global financial landscape entered the final stretch of 2025 with a sophisticated display of “high-altitude” consolidation. Following the post-Christmas sessions, the market on December 27, 2025, saw major Western indices secure significant weekly gains despite a fractionally lower Saturday close for those markets still active. The narrative remains dominated by two historic structural shifts: the absolute triumph of the “AI Infrastructure Cycle” and a generational breakout in precious metals that has decoupled gold and silver from traditional yield-bearing assets.
As we move into Monday, December 29, the market is navigating a low-volume environment where technical levels carry outsized importance. While the U.S. Dollar Index (DXY) hovers near the 98.00 psychological floor, emerging markets like India and Japan are finding a renewed bid from domestic institutional liquidity. This report provides a granular analysis of the Dec 27 closing data and the live digital pulses currently defining the transition into 2026.
| Index | Closing Value | Weekly Change | Performance |
| Dow Jones (DJI) | 48,710.97 | +1.2% | Blue-chip Resilience |
| S&P 500 (SPX) | 6,929.94 | +1.4% | New Intraday Highs |
| NASDAQ Composite | 23,593.10 | +1.2% | AI Sector Strength |
| Nikkei 225 (Japan) | 50,499.25 | +1.6% | Record Levels |
| GIFT Nifty (Live) | 26,012.50 | +0.12% | Festive Buying |
| SSE Composite | 3,975.92 | +0.31% | Industrial Recovery |
| Asset | Live Price (USD) | 24h Change | Market Sentiment |
| Bitcoin (BTC) | $87,842.50 | +0.42% | Testing Resistance |
| Ethereum (ETH) | $2,948.10 | +0.15% | Neutral |
| Solana (SOL) | $124.20 | +0.55% | Ecosystem Stability |
| BNB (Binance) | $858.15 | +2.10% | Outperforming |
| XRP | $1.87 | +0.22% | Rangebound |
| Commodity | Live/LTP | Performance | Status |
| Spot Gold | $4,548.50/oz | +0.42% | All-time High |
| Silver | $79.12/oz | +3.60% | Historic Breakout |
| WTI Crude Oil | $56.85/bbl | -2.65% | Multi-year Downtrend |
| Brent Crude Oil | $61.12/bbl | +0.55% | Supply Surplus |
| Copper | $5.51/lb | +1.20% | Industrial Demand |
| Currency Pair | Live Rate | Change (%) | Trend |
| US Dollar Index | 98.05 | +0.04% | Stabilizing |
| EUR/USD | 1.1782 | -0.02% | Bullish Structure |
| GBP/USD | 1.3512 | +0.05% | Testing Resistance |
| USD/JPY | 156.18 | -0.08% | Carry Trade Unwind |
| USD/INR | 89.52 | -0.08% | Strong Rupee |
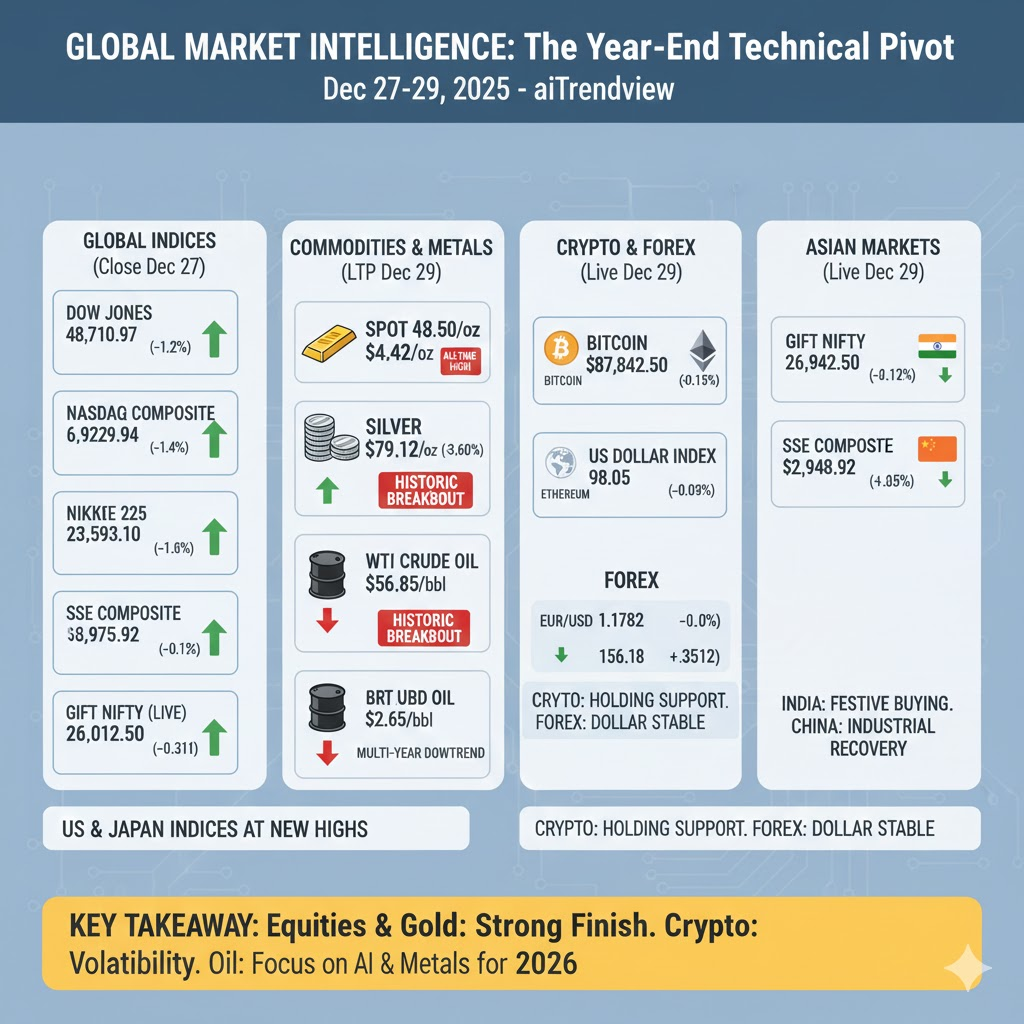
The market as of December 29, 2025, reflects a sophisticated year-end rotation. We are seeing a “Barbell Strategy” where investors are holding high-growth Tech Equities on one end and “Hard Assets” like Gold/Silver on the other. Crypto is currently the laggard due to holiday deleveraging, but the long-term structure remains healthy. The key levels to watch for the week are $88,500 on Bitcoin and the 97.80 support on the Dollar Index.
aiTrendview Global Disclaimer
This aiTrendview report is an AI-generated document provided exclusively for educational and training purposes and shall not be construed as investment, financial, legal, or tax advice in any jurisdiction.
aiTrendview and its affiliates are not SEBI-registered research analysts, investment advisers, or portfolio managers, and all information herein is automatically compiled from publicly available sources that may contain errors, delays, or omissions.
Users must independently verify all data before making any financial, commercial, or legal decisions, as no market values, performance figures, or trends contained in this report constitute guarantees or forward-looking statements.
Nothing in this publication should be interpreted as a solicitation, recommendation, or endorsement to buy, sell, or hold any security.
aiTrendview, its creators, and all associated AI systems disclaim all liability for losses or consequences arising from the use or reliance upon this content, and users accept full personal responsibility for all actions taken based on it.
Unauthorized reproduction, distribution, or modification of this AI-generated material is strictly prohibited under international copyright, compliance, and intellectual-property laws.