While the market often focuses on GPU providers, Broadcom has quietly secured its position as the indispensable provider of the “plumbing” for the AI era. In FY 2025, the company proved that its acquisition of VMware was not just a financial play, but a strategic move to create a recurring-revenue floor for its high-growth, high-volatility semiconductor business.
Broadcom reported record full-year FY 2025 revenue of $63.89 billion, a massive 24% year-over-year increase. This growth was balanced between its two core segments: Semiconductor Solutions ($36.86 billion) and Infrastructure Software ($27.03 billion). The revenue trajectory is accelerating, with Q4 alone growing 28% YoY, signaling that the AI spending cycle is still in its early-to-mid innings.
Broadcom’s AI-related revenue has reached an escape velocity. In FY 2025, AI revenue surged 65% to $20 billion, now representing over 30% of total company revenue and roughly 54% of its semiconductor segment. The demand is driven by custom AI accelerators (XPUs) for hyperscalers like Google and Meta, and high-end Ethernet switches (Tomahawk 5/6) required to connect massive GPU clusters.
The “VMware effect” is now fully visible in the financials. Infrastructure Software revenue grew 26% YoY to $27 billion, largely driven by the successful migration of the top 10,000 VMware customers to the VMware Cloud Foundation (VCF) subscription model. This shift has created a massive, high-margin, predictable cash flow stream that protects the company during semiconductor down-cycles.
Broadcom remains an “EBITDA machine.” The company achieved an Adjusted EBITDA of $43.0 billion for FY 2025, representing a staggering 67.3% margin. This industry-leading profitability is the result of Broadcom’s “Hock Tan Model”: focusing exclusively on sustainable, “franchise” technologies that command high pricing power and dominant market share.
On a GAAP basis, Broadcom reported Net Income of $23.13 billion for FY 2025 ($4.77 per diluted share). However, for advanced readers, the Non-GAAP Net Income of $33.73 billion ($6.82 EPS) provides a clearer picture of operational health, as it excludes the significant non-cash amortization and integration costs associated with the $61 billion VMware acquisition.
Broadcom’s business model is exceptionally capital-light compared to its peers. In FY 2025, it generated $26.91 billion in Free Cash Flow, representing 42% of revenue. Because Broadcom is fabless (outsourcing manufacturing to TSMC) and maintains low CapEx intensity (only $1.1B in FY25), nearly every dollar of operating profit is available for debt reduction and shareholder returns.
One of the most bullish signals is the total order backlog of $162 billion. Of this, the AI-specific semiconductor backlog exceeds $73 billion, to be delivered over the next 18 months. This provides investors with rare revenue visibility in a cyclical industry and suggests that the 20%–30% growth guidance for early 2026 is well-supported by firm orders.
Broadcom’s consolidated Non-GAAP Gross Margin stood at 77.9% in Q4 2025. While the shift toward custom AI accelerators (which have slightly lower margins than standard networking chips) created some “mix pressure,” this was offset by the 93% gross margins in the Infrastructure Software segment. This dual-segment structure allows Broadcom to maintain elite profitability even as it aggressively pursues AI hardware volume.
Post-VMware, Broadcom has been aggressively deleveraging. It ended FY 2025 with $16.18 billion in cash. While the company still carries significant debt from the acquisition, its Net Debt-to-EBITDA ratio has fallen below 2.3x, down significantly from the peak. This rapid deleveraging has allowed the company to raise its dividend by 10% to $2.60 annually for FY 2026.
Broadcom is increasingly viewed as the primary alternative to NVIDIA for AI exposure. While NVIDIA dominates the GPU (General Purpose) market, Broadcom dominates the ASIC (Custom Silicon) market. With a forward P/E currently reflecting a “software-plus-AI” premium, the valuation is supported by the fact that Broadcom’s software floor prevents the “boom-bust” cycles seen in other semi stocks.
| Key Metric (FY 2025) | Performance Value | YoY Change / Trend | Strategic Investor Insight |
| Total Revenue | $63.89 Billion | 🟢 +24% | Driven by the first full year of VMware and AI surge. |
| AI Revenue | $20.00 Billion | 🟢 +65% | Now the dominant growth engine within Semiconductors. |
| Adjusted EBITDA | $43.00 Billion | 🟢 +35% | Elite 67% margin; shows massive operating leverage. |
| Free Cash Flow | $26.91 Billion | 🟢 +39% | Represents a 42% FCF margin; funds dividend growth. |
| Infrastructure Software | $27.03 Billion | 🟢 +26% | VMware integration is yielding high-margin synergies. |
| Total Backlog | $162.0 Billion | 🟢 Record | $73B of this is AI-related; ensures 2026 visibility. |
| Cash Position | $16.18 Billion | 🟢 +51% | Strong liquidity used for debt paydown and dividends. |
| Parameter | Broadcom (AVGO) | NVIDIA (NVDA) | Marvell (MRVL) |
| AI Strategy | Custom ASICs & Networking | Standard GPUs (H100/Blackwell) | Custom ASICs & Optical |
| Software Mix | 42% (High Margin) | <15% (Growing) | <5% |
| EBITDA Margin | 67.3% | 65% – 70% | ~35% |
| Capital Intensity | Low (Fabless + Soft.) | Low (Fabless) | Low (Fabless) |
| Market Role | Data Center “Plumbing” | Data Center “Brain” | Data Center “Connectivity” |
Broadcom stands out for its 42% software mix, which provides a stability that NVIDIA lacks. While NVIDIA’s growth is more explosive, Broadcom’s diversified model offers a more resilient fundamental profile for the conservative institutional investor.
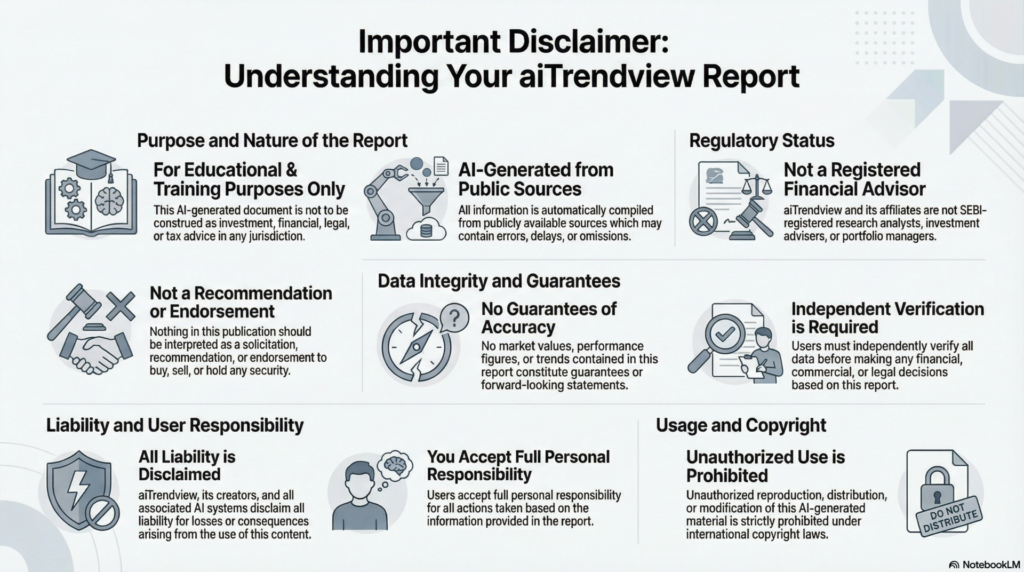
aiTrendview Global Disclaimer
This aiTrendview report is an AI-generated document provided exclusively for educational and training purposes and shall not be construed as investment, financial, legal, or tax advice in any jurisdiction.
aiTrendview and its affiliates are not SEBI-registered research analysts, investment advisers, or portfolio managers, and all information herein is automatically compiled from publicly available sources that may contain errors, delays, or omissions.
Users must independently verify all data before making any financial, commercial, or legal decisions, as no market values, performance figures, or trends contained in this report constitute guarantees or forward-looking statements.
Nothing in this publication should be interpreted as a solicitation, recommendation, or endorsement to buy, sell, or hold any security.
aiTrendview, its creators, and all associated AI systems disclaim all liability for losses or consequences arising from the use or reliance upon this content, and users accept full personal responsibility for all actions taken based on it.
Unauthorized reproduction, distribution, or modification of this AI-generated material is strictly prohibited under international copyright, compliance, and intellectual-property laws.