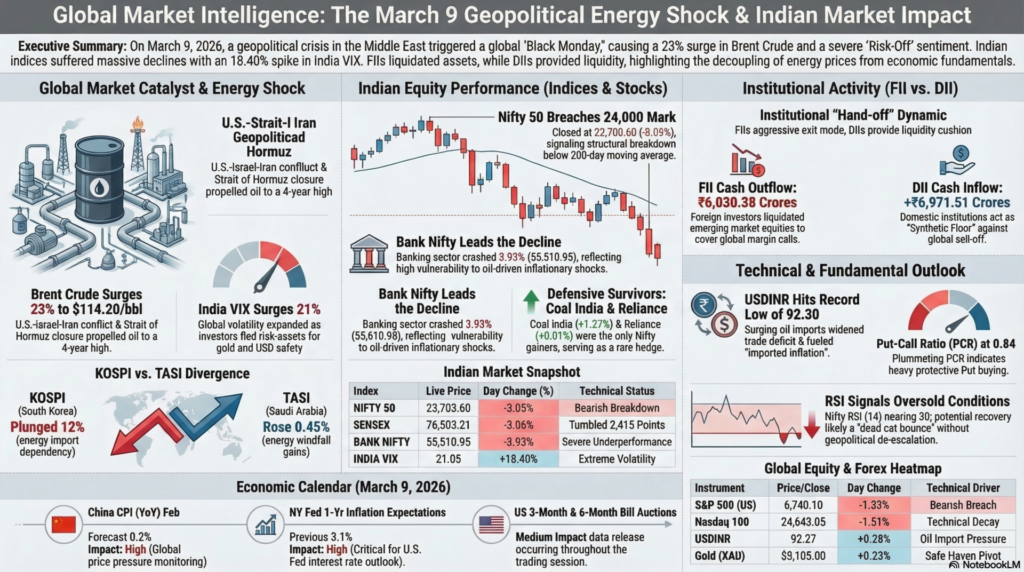
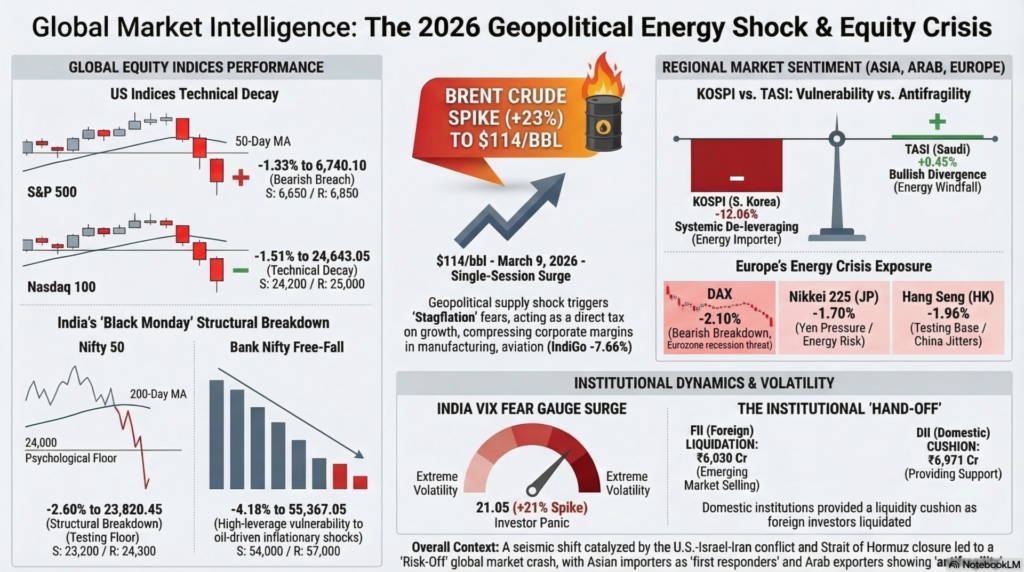
The trading session of Monday, March 9, 2026, is witnessing a seismic shift in global capital flows as the intensifying U.S.-Israel-Iran conflict reaches a boiling point. The reported closure of the Strait of Hormuz and strikes on energy infrastructure have propelled Brent crude past $114 per barrel, a level not seen in nearly four years, sparking immediate panic across energy-importing nations. This energy shock is occurring simultaneously with a fragile U.S. macro backdrop, where recent labor data showed a surprising contraction, raising the specter of “Stagflation”—high inflation coupled with stagnant growth. Equity markets globally are in “Risk-Off” mode, with the India VIX surging 21% and Asian benchmarks like the Nikkei and KOSPI plunging as investors flee high-beta assets for the safety of gold and the U.S. dollar.
Institutional activity reveals a deep “Hand-off” dynamic; while Foreign Institutional Investors (FIIs) are aggressively liquidating emerging market equities to cover margin calls and safe-haven rotations, Domestic Institutional Investors (DIIs) in markets like India are providing a heroic liquidity cushion. However, the sheer magnitude of the oil spike—up over 23% in early trade—is overwhelming defensive postures, as concerns over trade deficits and fiscal pressure mount for major importers. Traders are entering the week with extreme caution, closely monitoring the U.S. NY Fed Consumer Inflation Expectations and the China CPI release for any signs that price pressures are becoming structurally unanchored.
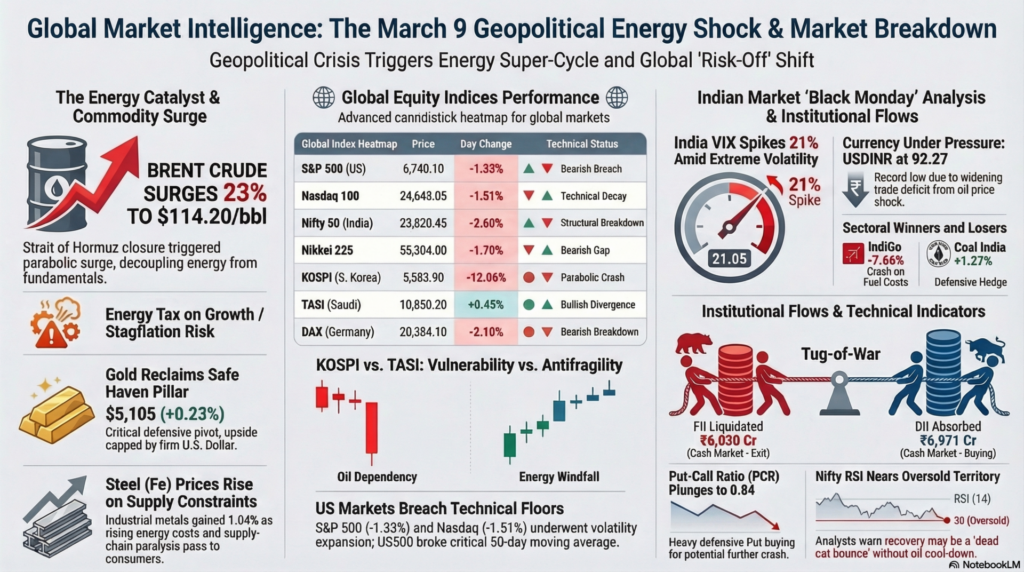
| Index | Price / Close | Day Change (%) | Technical Status | Future Support / Resistance |
| S&P 500 (US) | 6,740.10 | -1.33% | Bearish Breach | Support: 6,650 / Resistance: 6,850 |
| Nasdaq 100 | 24,643.05 | -1.51% | Technical Decay | Support: 24,200 / Resistance: 25,000 |
| Dow Jones | 47,502.20 | -0.85% | Testing Floor | Support: 47,000 / Resistance: 48,200 |
| Nifty 50 (India) | 23,820.45 | -2.60% | Structural Breakdown | Support: 23,200 / Resistance: 24,300 |
| Bank Nifty | 55,367.05 | -4.18% | Bearish Gap | Support: 54,000 / Resistance: 57,000 |
Technical Analysis: Western indices are undergoing a “Volatility Expansion” as the US500 breaks its 50-day moving average. In India, the Nifty has plummeted below the 24,000 psychological mark, with the RSI dipping near 30, signaling oversold conditions but lacking a reversal trigger.
Fundamental Analysis: The primary drag is the “Energy Tax” on growth; rising fuel costs are expected to compress corporate margins across manufacturing and retail. FII selling (₹3,296 Cr) remains the dominant force in EM outflows.
| Index | Price / Close | Day Change (%) | Technical Movement | Headline Sentiment |
| Nikkei 225 | 55,304.00 | -1.70% | Bearish Gap | Yen Pressure/Energy Risk |
| KOSPI | 5,583.90 | -12.06% | Parabolic Crash | Systemic De-leveraging |
| Hang Seng | 25,630.55 | -1.96% | Testing Base | China Macro Jitters |
| TASI (Saudi) | 10,850.20 | +0.45% | Bullish Divergence | Energy Sector Windfall |
| DAX (Germany) | 20,384.10 | -2.10% | Bearish Breakdown | Energy Crisis Exposure |
Research Report: Asian markets are the “First Responders” to the Strait of Hormuz crisis; South Korea’s KOSPI has suffered a catastrophic 12% drop, reflecting the nation’s extreme vulnerability as it imports 70% of its oil from the Middle East. Conversely, Arab markets like the Saudi TASI are showing “Antifragility,” gaining 0.45% as state-run energy giants capitalize on triple-digit oil prices. Europe’s DAX is facing a fundamental de-rating as the prospect of supply-chain paralysis threatens to push the Eurozone into a deep recession.
| Instrument | Price / Close | Day Change (%) | Technical Support | Headline Driver |
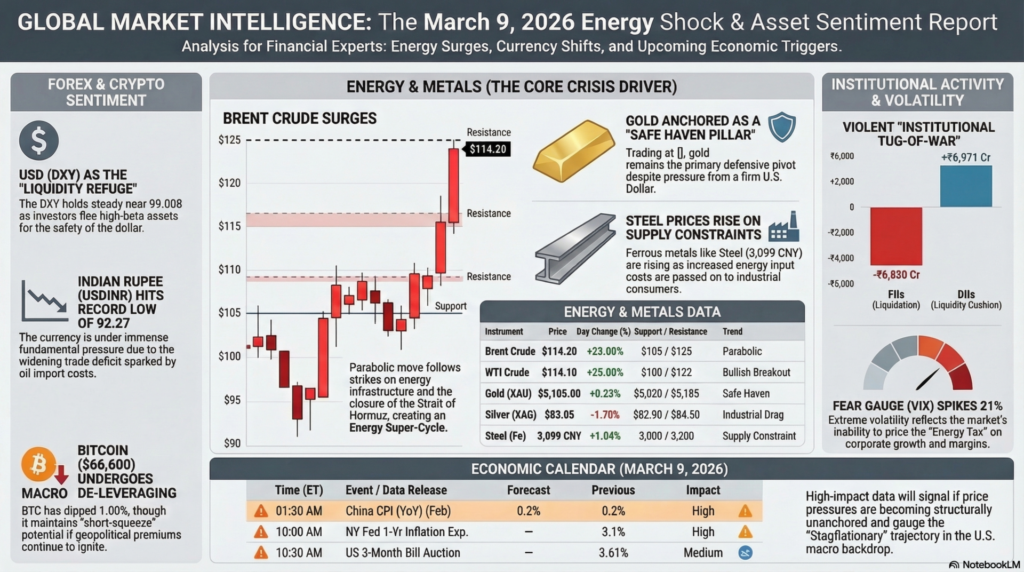
| DXY (USD) | 99.008 | -0.06% | 98.50 | Safe Haven Demand |
| USDINR | 92.270 | +0.28% | 91.50 | Oil Import Pressure |
| Bitcoin (BTC) | $66,600 | -1.00% | $63,000 | Macro Uncertainty |
| Ethereum (ETH) | $1,955 | -0.40% | $1,850 | Liquidity Drain |
Analysis: The U.S. Dollar (DXY) remains the “Liquidity Refuge,” trading near 99.00. However, the Indian Rupee (INR) is under immense fundamental pressure, sliding to 92.27 due to the widening trade deficit sparked by oil. In the crypto space, Bitcoin has dipped below $67,000 as risk-assets de-leverage, though it holds a “Short-Squeeze” potential if the geopolitical premium re-ignites.
| Instrument | Price | Day Change (%) | Support / Resistance | Movement / Trend |
| Brent Crude | $114.20 | +23.00% | $105 / $125 | Parabolic Surge |
| WTI Crude | $114.10 | +25.00% | $100 / $122 | Bullish Breakout |
| Gold (XAU) | $5,105.00 | +0.23% | $5,020 / $5,185 | Safe Haven Pivot |
| Silver (XAG) | $83.05 | -1.70% | $82.90 / $84.50 | Industrial Drag |
| Steel (Fe) | 3,099 CNY | +1.04% | 3,000 / 3,200 | Supply Constraint |
Analysis: Crude oil is in an “Energy Super-Cycle,” with Brent surging 23% in a single session to $114 following intensified strikes in the Middle East. Gold remains a “Safe Haven Pillar,” trading stably near $5,100, though its upside is partially capped by a firm U.S. dollar. Ferrous metals like Steel are rising as supply-chain costs and energy input prices are passed onto industrial consumers.
On Monday, March 9, 2026, the Indian equity markets experienced a massive “Black Monday” style crash. The primary catalyst was a “Stagflationary Shock” triggered by the intensifying U.S.-Israel-Iran conflict, which caused crude oil prices to surge past $114 per barrel, unsettling major oil-importing economies like India.
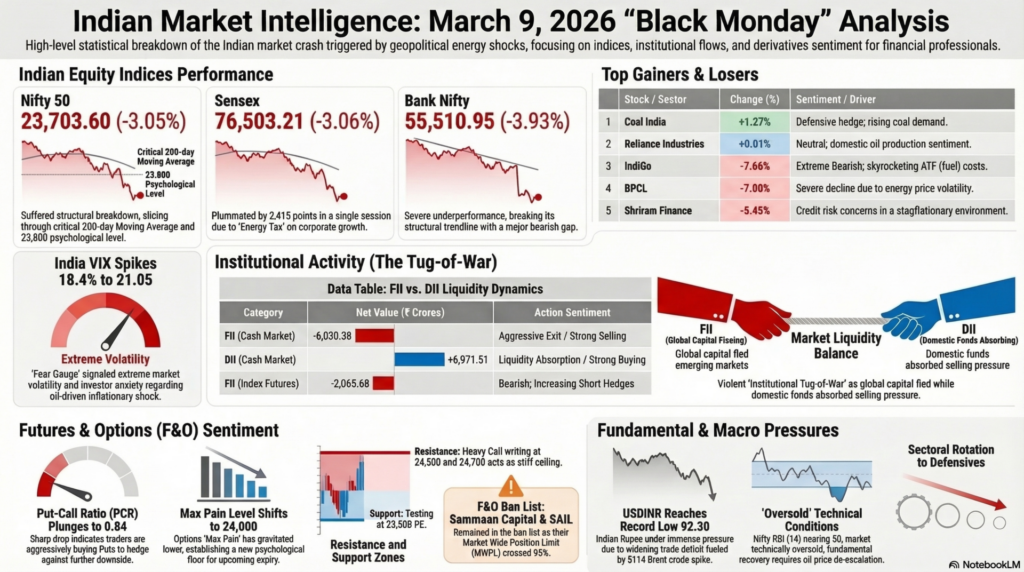
| Index | Live Price (Approx) | Change (%) | Technical Status |
| NIFTY 50 | 23,703.60 | -3.05% | Breached 23,800; Bearish Breakdown |
| SENSEX | 76,503.21 | -3.06% | Tumbled 2,415 Points |
| BANK NIFTY | 55,510.95 | -3.93% | Severe Underperformance; Support Lost |
| INDIA VIX | 21.05 | +18.4% | Fear Gauge Spiked; Extreme Volatility |
Top Gainers & Losers (Nifty 50):
The market witnessed a violent “Institutional Tug-of-War.” Foreign investors are in a flight-to-safety mode, while domestic institutions are providing a massive liquidity cushion.
| Category | Net Buy/Sell (₹ Crores) | Action Sentiment |
| FII (Cash Market) | -6,030.38 | Strong Selling (Aggressive Exit) |
| DII (Cash Market) | +6,971.51 | Strong Buying (Liquidity Absorption) |
| FII (Index Futures) | -2,065.68 | Bearish (Increasing Short Hedges) |
Technical Analysis:
Fundamental Analysis:
| Time (ET) | Event / Data Release | Forecast | Previous | Impact |
| 01:30 AM | China CPI (YoY) (Feb) | 0.2% | 0.2% | High |
| 09:00 AM | CB Employment Trends Index | — | 105.06 | Medium |
| 10:00 AM | NY Fed 1-Yr Consumer Inflation Exp. | — | 3.1% | High |
| 10:30 AM | US 3-Month & 6-Month Bill Auctions | — | 3.61% / 3.53% | Medium |
For educational and training purposes, today’s session illustrates a “Geopolitical Supply Shock” in its purest form. When a critical maritime chokepoint like the Strait of Hormuz is threatened, the price of energy decouples from economic fundamentals and follows “Risk Premiums” exclusively. For a trainee trader, the key takeaway is the VIX-Sectoral Correlation; the India VIX jumped 21% while Bank Nifty fell over 4%, proving that banking and high-leverage sectors are the most vulnerable to oil-driven inflationary shocks.
Secondly, the “Synthetic Floor” created by DIIs (+₹12,000 Cr) against FII selling is a masterclass in market decoupling. While global capital is fleeing, domestic liquidity is attempting to anchor the floor. However, with Brent at $114, the fundamental “import inflation” pressure may eventually breach these technical supports. Traders should maintain high cash levels, prioritize Gold as a safety pillar, and avoid cyclical “Risk-On” sectors until de-escalation headlines emerge.
Legal Disclaimer & Liability Waiver – aiTrendview.com
All content, reports, signals, analytics, forecasts, and materials published on aiTrendview.com are fully AI-generated outputs produced through automated systems with zero human research, manual validation, editorial review, or professional intervention. This platform does not provide financial, investment, trading, legal, tax, or professional advice of any kind. aiTrendview.com, its owners, affiliates, and associated entities are not registered with SEBI or any other regulatory authority as investment advisors, research analysts, brokers, or financial consultants. All data is autonomously aggregated from publicly available sources and algorithmic processes that may contain inaccuracies, delays, omissions, or technical errors. Users are solely and exclusively responsible for independently verifying all information before making any financial, legal, or commercial decisions.
By accessing or using this platform, you expressly acknowledge and agree that any reliance on the information provided is entirely at your own risk. aiTrendview.com assumes absolutely no liability for any direct, indirect, incidental, consequential, financial, legal, trading, or other losses arising from the use of, reliance upon, or inability to use any content or data published. Nothing on this platform shall be construed as a solicitation, endorsement, or recommendation to buy, sell, hold, or speculate in any security, derivative, commodity, cryptocurrency, or financial instrument. All intellectual property, including but not limited to algorithms, report structures, proprietary formats, branding, and system outputs, is strictly protected under applicable intellectual property laws. Unauthorized reproduction, redistribution, modification, or commercial exploitation is strictly prohibited and may result in civil and criminal legal action.