
Global equity markets traded largely in risk-off mode, reflecting rising volatility, weakness in US futures, and continued macro uncertainty surrounding inflation and monetary policy expectations. Major global indices indicated cautious sentiment among institutional investors as volatility surged and capital rotated toward commodities and defensive assets.
EXECUTIVE MARKET SUMMARY
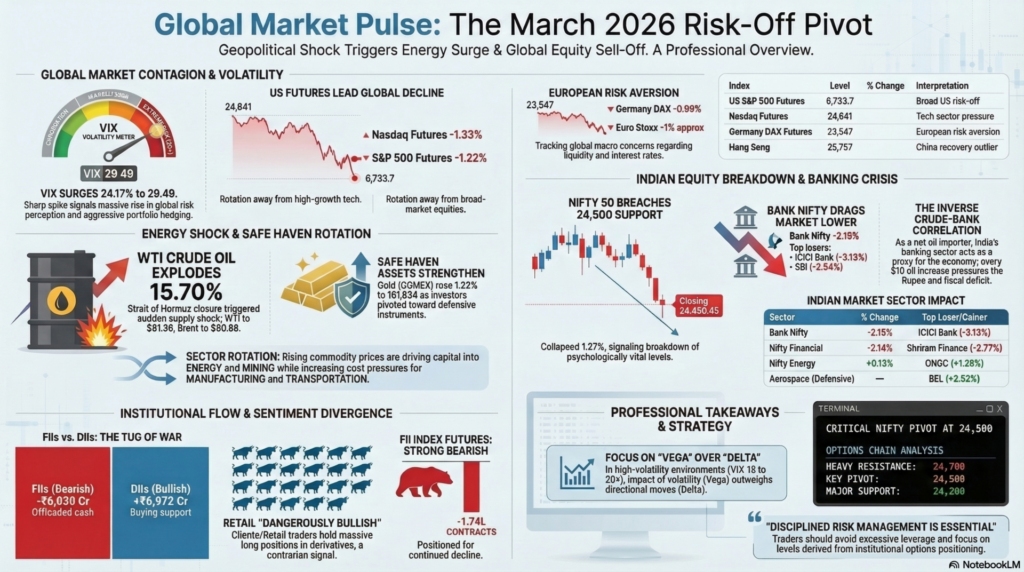
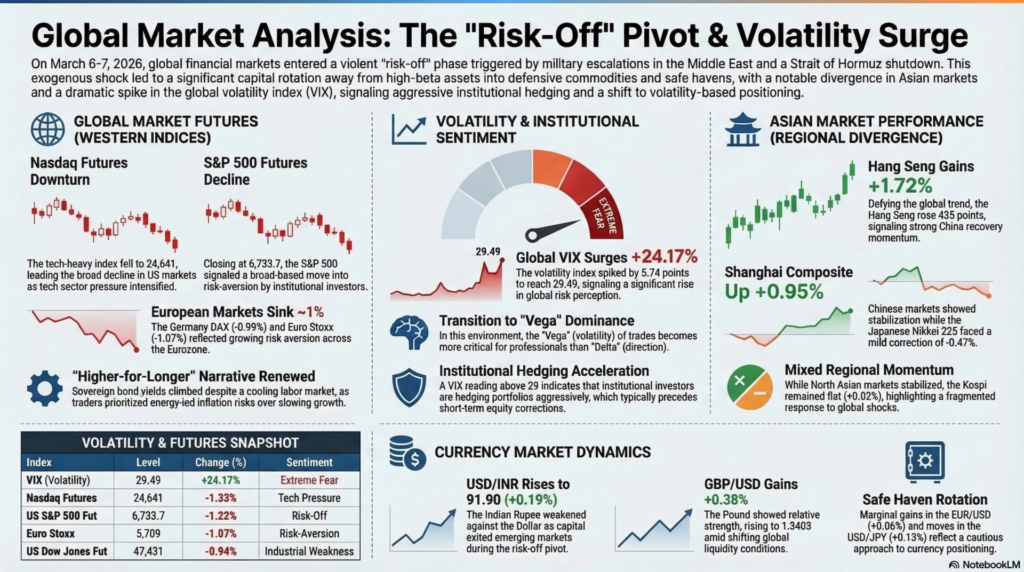
The global financial landscape on March 6, 2026, was defined by a violent “risk-off” pivot as the military conflict between the US-Israel alliance and Iran entered a critical escalation phase. Markets were rattled by the near-complete shutdown of the Strait of Hormuz, a vital artery for global energy, which sent crude oil prices spiraling toward multi-year highs. This exogenous shock forced a radical repricing of inflation expectations and interest rate trajectories. In the US, major indices tumbled as the “higher-for-longer” narrative gained renewed momentum, while sovereign bond yields climbed despite a cooling labor market, signaling that traders are prioritizing energy-led inflation risks over slowing growth.
Domestic markets mirrored this global distress, with the NSE Nifty 50 collapsing 1.27% to close at 24,450.45, breaching the psychologically vital 24,500 support level. The carnage was most visible in high-beta sectors like Banking and Realty, which faced the brunt of foreign institutional selling. FIIs offloaded a massive ₹15,800 crore (net for the month to date), overwhelming domestic support. Volatility, as measured by the India VIX, surged by 11.33%, hitting a high of 19.88. Amidst the sea of red, defensive pockets like Aerospace (BEL) and Energy (Reliance, ONGC) stood out as lone outperfomers, acting as natural hedges against the deteriorating geopolitical backdrop.
| Index | Level | Change | % Change | Interpretation |
|---|---|---|---|---|
| US S&P 500 Futures | 6,733.7 | -83.4 | -1.22% | Broad US market risk-off |
| US Dow Jones Futures | 47,431 | -452 | -0.94% | Industrial sector weakness |
| Nasdaq Futures | 24,641 | -331.6 | -1.33% | Tech sector pressure |
| Germany DAX Futures | 23,547 | -235 | -0.99% | European risk aversion |
| Euro Stoxx | 5,709 | -62 | -1.07% | Broad European decline |
| Index | Level | Change | % Change | Interpretation |
|---|---|---|---|---|
| Hang Seng | 25,757 | +435 | +1.72% | China recovery momentum |
| Nikkei 225 | 54,018 | -254 | -0.47% | Mild correction |
| Shanghai | 2,698 | +25 | +0.95% | Stabilization |
| Kospi | 5,584 | +0.97 | +0.02% | Flat session |
| Pair | Level | Change | % Change |
|---|---|---|---|
| EUR/USD | 1.1615 | +0.0007 | +0.06% |
| GBP/USD | 1.3403 | +0.0050 | +0.38% |
| USD/JPY | 157.75 | +0.20 | +0.13% |
| USD/INR | 91.90 | +0.17 | +0.19% |
| Index | Level | Change | % Change |
|---|---|---|---|
| VIX | 29.49 | +5.74 | +24.17% |
Interpretation
The sharp surge in the VIX volatility index above 29 signals a significant rise in global risk perception. Institutional investors appear to be hedging portfolios aggressively, which typically leads to short-term equity corrections.
Weakness in US futures and European markets indicates that global macro concerns are influencing investor behavior, particularly around interest rate expectations and liquidity conditions.
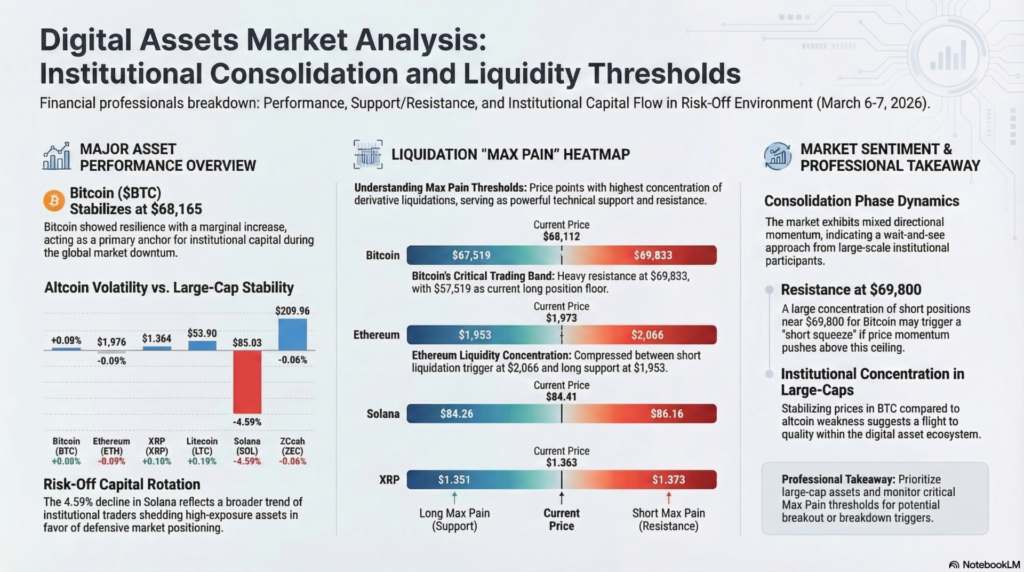
Cryptocurrency markets showed mixed performance with Bitcoin stabilizing while altcoins experienced greater volatility. Derivatives liquidation data indicates that crypto markets are currently trading near key leverage thresholds.
| Cryptocurrency | Price | Change | % Change |
|---|---|---|---|
| Bitcoin | $68,165 | +57 | +0.08% |
| Ethereum | $1,976 | -1.8 | -0.09% |
| Dogecoin | $0.091 | 0 | 0% |
| Litecoin | $53.90 | +0.10 | +0.19% |
| Solana | $85.03 | -4.09 | -4.59% |
| XRP | $1.364 | +0.0013 | +0.10% |
| ZCash | $209.96 | -0.12 | -0.06% |
| Asset | Current Price | Short Max Pain | Long Max Pain |
|---|---|---|---|
| Bitcoin | $68,112 | $69,833 | $67,519 |
| Ethereum | $1,973 | $2,066 | $1,953 |
| Solana | $84.41 | $86.16 | $84.26 |
| XRP | $1.363 | $1.373 | $1.351 |
The cryptocurrency market is currently in a consolidation phase with mixed directional momentum. Bitcoin remains relatively stable compared to altcoins, suggesting that institutional capital is concentrating in large-cap digital assets while speculative tokens experience higher volatility.
The liquidation heatmap indicates strong resistance near $69,800 for Bitcoin, where a large concentration of short positions may trigger liquidation if price moves higher. Conversely, the $67,500 region acts as a critical support zone, making this the near-term trading band for Bitcoin.
Altcoins such as Solana declining over 4% reflect a typical risk-off environment where traders reduce exposure to high-beta assets first.
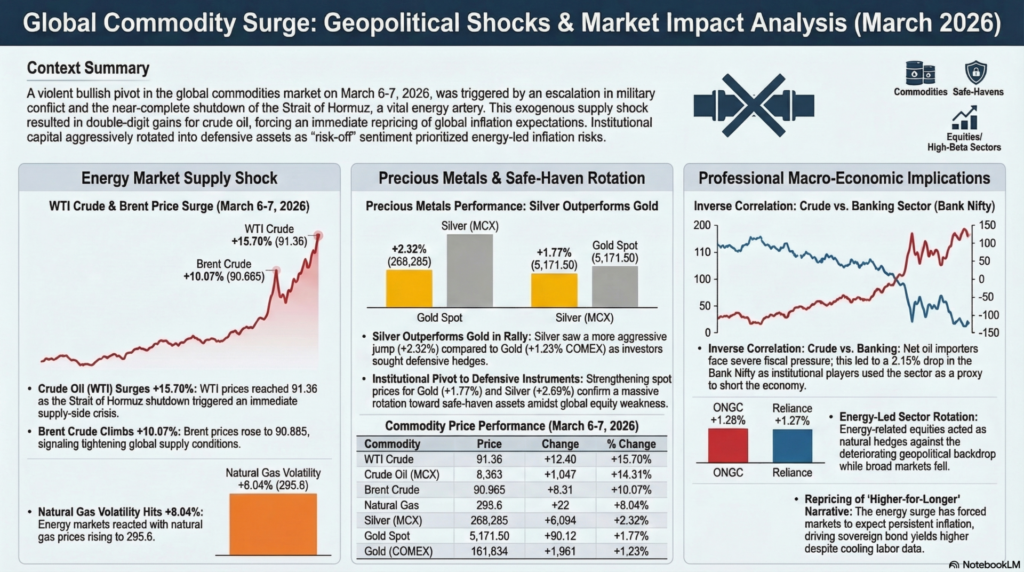
Commodity markets showed strong bullish momentum led by energy prices and precious metals, reflecting increasing macro uncertainty and inflation expectations.
| Commodity | Price | Change | % Change |
|---|---|---|---|
| Gold (COMEX) | 161,634 | +1,961 | +1.23% |
| Silver | 268,285 | +6,094 | +2.32% |
| Crude Oil | 8,363 | +1,047 | +14.31% |
| Natural Gas | 295.6 | +22 | +8.04% |
| Brent Crude | 90.865 | +8.31 | +10.07% |
| WTI Crude | 91.36 | +12.40 | +15.70% |
| Silver Spot | 84.47 | +2.21 | +2.69% |
| Gold Spot | 5,171.50 | +90.12 | +1.77% |
The sharp rally in crude oil and natural gas signals tightening supply conditions and rising geopolitical or macroeconomic risks affecting the global energy market. Oil’s double-digit surge indicates a sudden supply shock or strong demand expectations, which typically raises inflation concerns globally.
At the same time, gold and silver are strengthening as safe-haven assets, suggesting that investors are increasing exposure to defensive instruments during periods of financial market uncertainty.
Rising commodity prices often lead to sector rotation toward energy and mining equities, while simultaneously increasing cost pressures for manufacturing and transportation sectors.
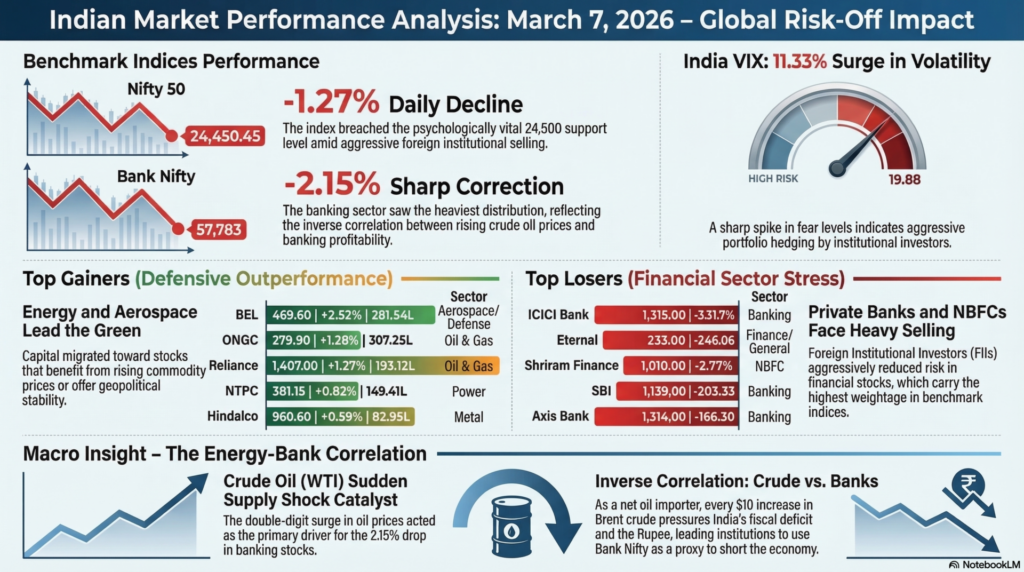
Indian equity markets experienced a broad decline driven primarily by weakness in banking stocks and financial services.
| Index | Level | Change | % Change |
|---|---|---|---|
| Sensex | 78,918 | -1,097 | -1.37% |
| Nifty 50 | 24,450 | -315 | -1.27% |
| Bank Nifty | 57,783 | -1,272 | -2.15% |
| FinNifty | 26,783 | -526 | -1.93% |
| Midcap Nifty | 13,168 | -106 | -0.80% |
| Sector | Level | Change | % Change |
|---|---|---|---|
| Nifty Financial | 26,652 | -583 | -2.14% |
| PSU Banks | 9,184 | -188 | -2.01% |
| Auto | 27,076 | -290 | -1.06% |
| Pharma | 22,970 | -35 | -0.15% |
| FMCG | 49,970 | -30 | -0.06% |
| Energy | 36,319 | +45 | +0.13% |
Indian markets faced significant pressure primarily due to heavy selling in financial stocks, which carry the largest weightage in benchmark indices. The Bank Nifty’s decline of more than 2% suggests institutional distribution rather than isolated stock-specific selling.
Foreign institutional investors appear to have reduced risk exposure in Indian equities amid rising global volatility and weakening global equity futures. The sharp spike in the volatility index further confirms the presence of hedging activity in the derivatives market.
Despite the decline, defensive sectors such as energy and utilities showed relative resilience, indicating early signs of sector rotation rather than a complete market breakdown.
| Stock | Price | % Change | Volume |
|---|---|---|---|
| BEL | 469.60 | +2.52% | 281.54L |
| ONGC | 279.90 | +1.28% | 307.25L |
| Reliance | 1,407 | +1.27% | 193.12L |
| NTPC | 381.15 | +0.82% | 149.41L |
| Hindalco | 960.60 | +0.59% | 82.95L |
| Stock | Price | % Change | Volume |
|---|---|---|---|
| ICICI Bank | 1,315 | -3.13% | 227.79L |
| Eternal | 233 | -2.96% | 446.06L |
| Shriram Finance | 1,010 | -2.77% | 81.67L |
| SBI | 1,139 | -2.54% | 203.33L |
| Axis Bank | 1,314 | -2.54% | 116.30L |
| Participant | Segment | Sentiment | Net OI | Change |
|---|---|---|---|---|
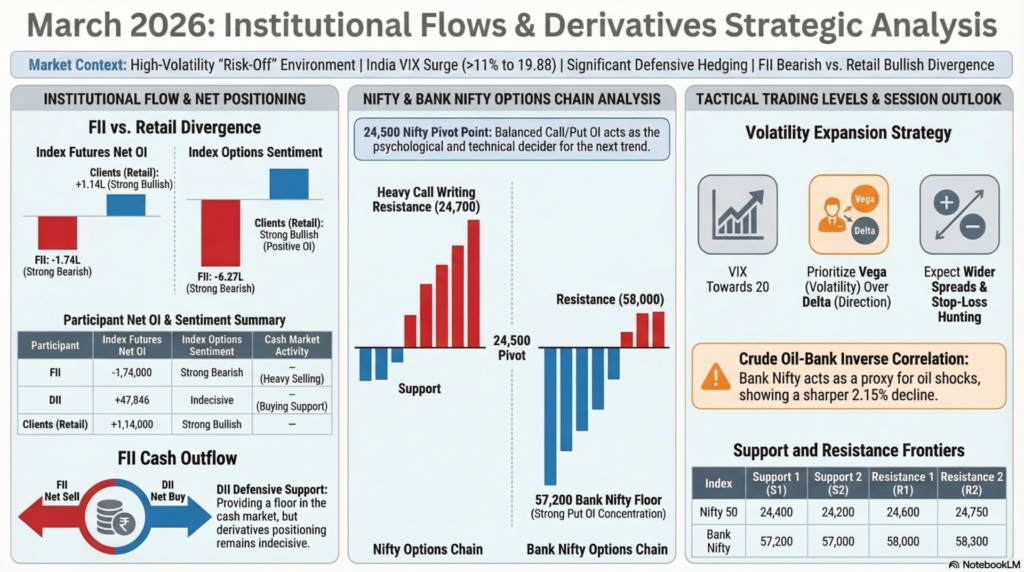
| FII | Index Futures | Strong Bearish | -1.74L | -12,443 |
| FII | Stock Futures | Indecisive | 11.79L | -15,051 |
| FII | Index Options | Strong Bearish | -6.27L | -1.4L |
| FII | Stocks | Strong Bearish | — | -₹6,030 Cr |
| Pro Traders | Index Futures | Mild Bullish | 12,354 | 817 |
| Pro Traders | Stock Futures | Mild Bullish | 4.2L | 3,006 |
| Pro Traders | Index Options | Medium Bearish | -2.24L | -1.69L |
| Clients | Index Futures | Strong Bullish | 1.14L | 13,166 |
| Clients | Stock Futures | Medium Bullish | 25.27L | 17,294 |
| Clients | Index Options | Strong Bullish | 8.81L | 3.06L |
| DII | Index Futures | Indecisive | 47,846 | -1,540 |
| DII | Stock Futures | Strong Bearish | -41.25L | -5,249 |
| DII | Index Options | Indecisive | -29,466 | 3,350 |
| DII | Stocks | Strong Bullish | — | ₹6,972 Cr |
The derivatives positioning clearly highlights a divergence between institutional and retail sentiment.
Foreign Institutional Investors (FIIs) maintained strong bearish positioning across index futures, index options, and cash equities, with net selling of approximately ₹6,030 crore in the cash market. The reduction in index futures open interest combined with heavy selling in options suggests that FIIs are reducing directional exposure while maintaining downside hedges.
Domestic Institutional Investors (DIIs), on the other hand, continued to support the market through cash buying of ₹6,972 crore, partially offsetting foreign selling pressure. However, their derivatives positioning remains mixed, indicating that DIIs are primarily providing stability in the cash market rather than taking aggressive directional bets.
Retail and client participants appear strongly bullish in derivatives, holding large long positions in both futures and options. Historically, when retail sentiment becomes excessively bullish while institutional traders turn defensive, markets often experience heightened volatility and potential downside pressure in the short term.
| Strike | Call OI | Put OI | Interpretation |
|---|---|---|---|
| 24,200 | High | Strong | Major support |
| 24,400 | Strong | Strong | Immediate support |
| 24,500 | Balanced | Balanced | Pivot level |
| 24,600 | High Call OI | Moderate | Resistance |
| 24,700 | Very High Call OI | Low | Strong resistance |
Market Interpretation
The options chain indicates that the 24,500 level remains the key pivot for the market. Strong put writing around 24,200–24,400 suggests that downside risk may be limited unless those levels break.
However, heavy call writing above 24,600 indicates that upside may remain capped in the near term.
| Strike | Call OI | Put OI | Interpretation |
|---|---|---|---|
| 57,200 | Moderate | Strong | Support |
| 57,500 | Strong | Strong | Support |
| 58,000 | Very High | Moderate | Resistance |
| 58,300 | Very High | Low | Strong resistance |
Expected trading range for Bank Nifty: 57,200 – 58,300
| Index | Support 1 | Support 2 | Resistance 1 | Resistance 2 | Expected Range |
|---|---|---|---|---|---|
| Nifty 50 | 24,400 | 24,200 | 24,600 | 24,750 | 24,200 – 24,750 |
| Bank Nifty | 57,200 | 57,000 | 58,000 | 58,300 | 57,200 – 58,300 |
Today’s session highlighted the critical influence of derivatives positioning and institutional capital flows on market direction. While macroeconomic developments such as commodity price movements and global equity weakness provided the initial catalyst, the magnitude of the decline was largely amplified by derivatives positioning and volatility expansion.
The surge in the volatility index combined with aggressive call writing suggests that institutional traders are positioning for continued near-term uncertainty. Such environments often produce sharp intraday moves and range-bound markets as large traders hedge portfolios.
For traders and analysts, the key takeaway lies in understanding the interaction between global macro signals, derivatives positioning, and sector rotation. Monitoring open interest changes, volatility indices, and institutional flows provides a much clearer view of potential market direction than relying solely on price action.
Disciplined risk management becomes essential during high volatility periods. Traders should focus on clearly defined support and resistance levels derived from options positioning while avoiding excessive leverage.
Markets driven by institutional positioning can shift direction quickly, making adaptability and data-driven decision making essential for consistent trading performance.
The current market environment serves as a textbook example of Volatility Expansion. When the VIX moves from 15 to nearly 20 in a matter of days, the “Delta” (direction) of your trade becomes less important than the “Vega” (volatility). Traders should realize that in such times, stop-losses are frequently hit due to wider bid-ask spreads and sudden spikes.
The most critical lesson is the Inverse Correlation between Crude and Banks. India is a net oil importer; every $10 increase in Brent crude exerts significant pressure on our fiscal deficit and the Rupee. This explains why the Bank Nifty dropped 2.15% while the broader market fell less. Institutional players use Bank Nifty as a proxy to short the Indian economy during oil shocks.
Legal Disclaimer & Liability Waiver – aiTrendview.com

All content, reports, signals, analytics, forecasts, and materials published on aiTrendview.com are fully AI-generated outputs produced through automated systems with zero human research, manual validation, editorial review, or professional intervention. This platform does not provide financial, investment, trading, legal, tax, or professional advice of any kind. aiTrendview.com, its owners, affiliates, and associated entities are not registered with SEBI or any other regulatory authority as investment advisors, research analysts, brokers, or financial consultants. All data is autonomously aggregated from publicly available sources and algorithmic processes that may contain inaccuracies, delays, omissions, or technical errors. Users are solely and exclusively responsible for independently verifying all information before making any financial, legal, or commercial decisions.
By accessing or using this platform, you expressly acknowledge and agree that any reliance on the information provided is entirely at your own risk. aiTrendview.com assumes absolutely no liability for any direct, indirect, incidental, consequential, financial, legal, trading, or other losses arising from the use of, reliance upon, or inability to use any content or data published. Nothing on this platform shall be construed as a solicitation, endorsement, or recommendation to buy, sell, hold, or speculate in any security, derivative, commodity, cryptocurrency, or financial instrument. All intellectual property, including but not limited to algorithms, report structures, proprietary formats, branding, and system outputs, is strictly protected under applicable intellectual property laws. Unauthorized reproduction, redistribution, modification, or commercial exploitation is strictly prohibited and may result in civil and criminal legal action.