

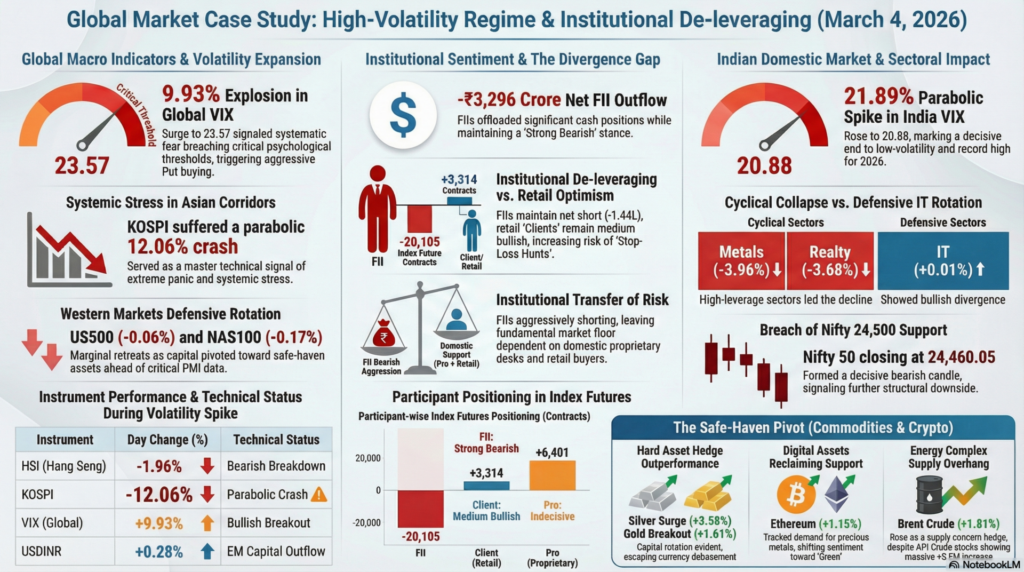
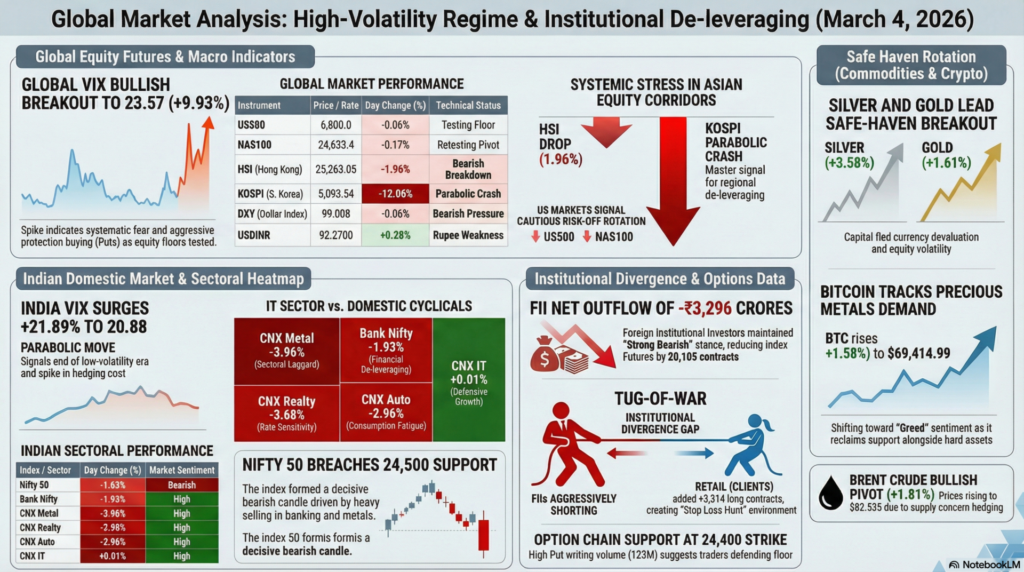
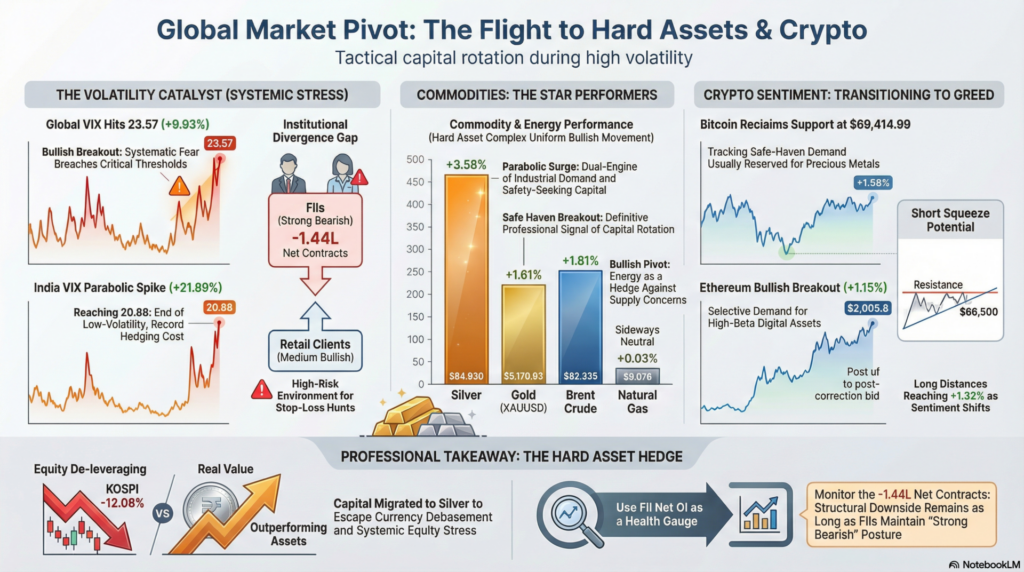
The global financial landscape on March 4, 2026, transitioned into a high-volatility regime as high-beta assets faced sharp de-leveraging across international borders. Western markets exhibited a synchronized retreat, with the US500 and NAS100 futures sliding marginally (-0.06% and -0.17% respectively), signaling a cautious stance ahead of critical services PMI data. European benchmarks like the FESX1 (+0.54%) and FDAX1 (+0.64%) traded with a bullish bias, diverging from the broad-based weakness in Asia where the Hang Seng Index crashed nearly 2%. The defining macro event of the session was the explosive 9.93% surge in the Global VIX to 23.57, indicating that systematic fear has breached critical psychological thresholds and capital is pivoting toward safe-haven assets.
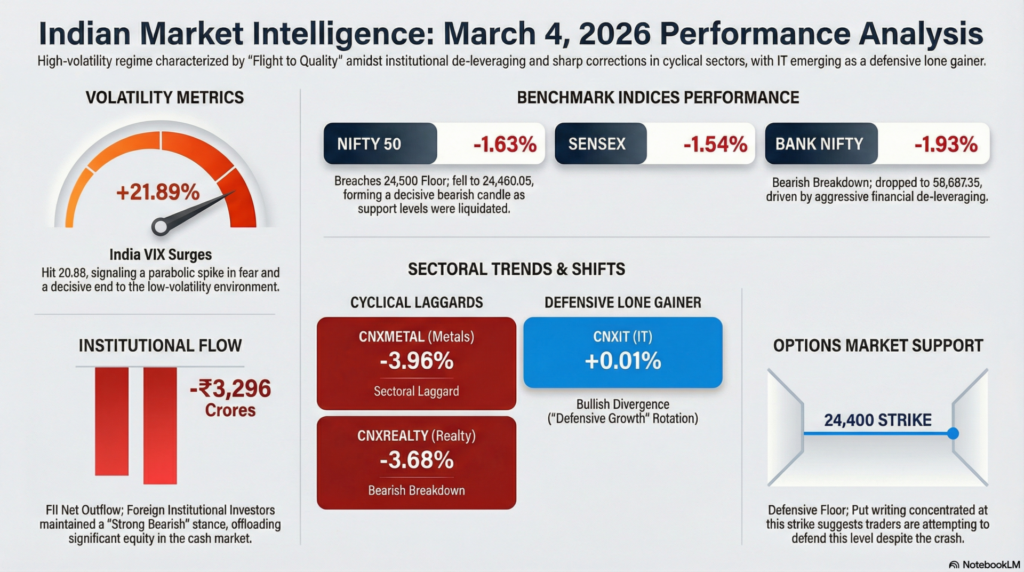
In the Indian domestic market, the narrative was dominated by an aggressive “Flight to Quality” as major benchmarks succumbed to selling pressure. The Nifty 50 and Sensex crashed 1.63% and 1.54% respectively, primarily dragged down by sharp corrections in metals and banking heavyweights. Institutional activity highlighted a massive divergence in participant-wise positioning; Foreign Institutional Investors (FIIs) offloaded a staggering net -₹3,296 Crores in stocks, while maintaining a “Strong Bearish” stance in Index Futures with a daily change of -20,105 contracts. Conversely, Domestic Institutional Investors provided a structural liquidity cushion, though the India VIX surged by a staggering 21.89% to 20.88, marking a decisive end to the low-volatility environment.
| Instrument | Price / Rate | Day Change (%) | Technical Movement | Key Event / Driver |
| US500 | 6,800.0 | -0.06% | Testing Floor | Risk-Off Rotation |
| NAS100 | 24,633.4 | -0.17% | Retesting Pivot | Tech Sector Drag |
| HSI | 25,263.05 | -1.96% | Bearish Breakdown | Regional De-leveraging |
| KOSPI | 5,093.54 | -12.06% | Parabolic Crash | Extreme Panic |
| VIX (Global) | 23.57 | +9.93% | Bullish Breakout | Volatility Spike |
| DXY | 99.008 | -0.06% | Bearish Pressure | Dollar Topping |
| USDINR | 92.2700 | +0.28% | Rupee Weakness | EM Capital Outflow |
Technical Analysis: Global futures are currently undergoing a “Volatility Expansion” phase. The 9.93% spike in the Global VIX suggests that market participants are aggressively buying protection (Puts) as the US500 tests psychological support at 6,800. The parabolic 12.06% crash in the KOSPI serves as a master technical signal of systemic stress in Asian equity corridors.
Fundamental Analysis: The overarching fundamental theme is the stabilization of interest rate expectations amidst a rising Dollar Index (DXY) approaching 99.0. Investors are reacting to a potential “Growth Scare” as manufacturing indices begin to show signs of cooling, leading to a tactical rotation out of emerging market currencies (Rupee -0.28%).
Economic Announcements: The session is front-loaded with critical services data, including the HCOB Composite PMI Final (Forecast: 51.9) and ISM Services PMI (Forecast: 53.5). Additionally, the API Crude Oil Stock Change (+5.6M actual vs +2.19M forecast) indicates a massive supply overhang, further complicating the macro outlook.
| Index / Sector | Last Price | Day Change (%) | Technical Movement | Event / Driver |
| NIFTY 50 | 24,460.05 | -1.63% | Breaching 24,500 Floor | FII Selling Pressure |
| BANK NIFTY | 58,687.35 | -1.93% | Bearish Breakdown | Financial De-leveraging |
| INDIA VIX | 20.88 | +21.89% | Parabolic Fear | Systematic Hedging |
| CNXMETAL | 11,784.20 | -3.96% | Sectoral Laggard | Commodity Weakness |
| CNXPSUBANK | 9,288.90 | -3.64% | Sharp Correction | Credit Growth Jitters |
| CNXAUTO | 26,724.85 | -2.96% | Bearish Pivot | Consumption Fatigue |
| CNXIT | 30,277.40 | +0.01% | Bullish Divergence | Defensive Tech Buying |
| CNXREALTY | 739.75 | -3.68% | Bearish Breakdown | Rate Sensitivity |
Technical Analysis: The Nifty 50 has formed a decisive bearish candle, breaching the 24,500 support level. The 21.89% surge in India VIX to 20.88 is a primary technical event, indicating that the cost of hedging has spiked to its highest levels of 2026. Sectorally, Metals (-3.96%) and Realty (-3.68%) are the primary laggards, signaling a fundamental pivot away from domestic cyclicals.
Fundamental Analysis: Domestic sentiment is under duress as blue-chip cyclicals lead the decline. However, the IT sector’s 0.01% gain suggests a fundamental rotation into “Defensive Growth” as investors seek shelter from the volatility in banking and financials.
Economic Announcements: Locally, the focus remains on the primary market and central bank guidance. Traders are monitoring Total Vehicle Sales (15.8M actual vs 15.2M forecast) as a proxy for urban consumption, which has failed to support the Auto index despite the beat.
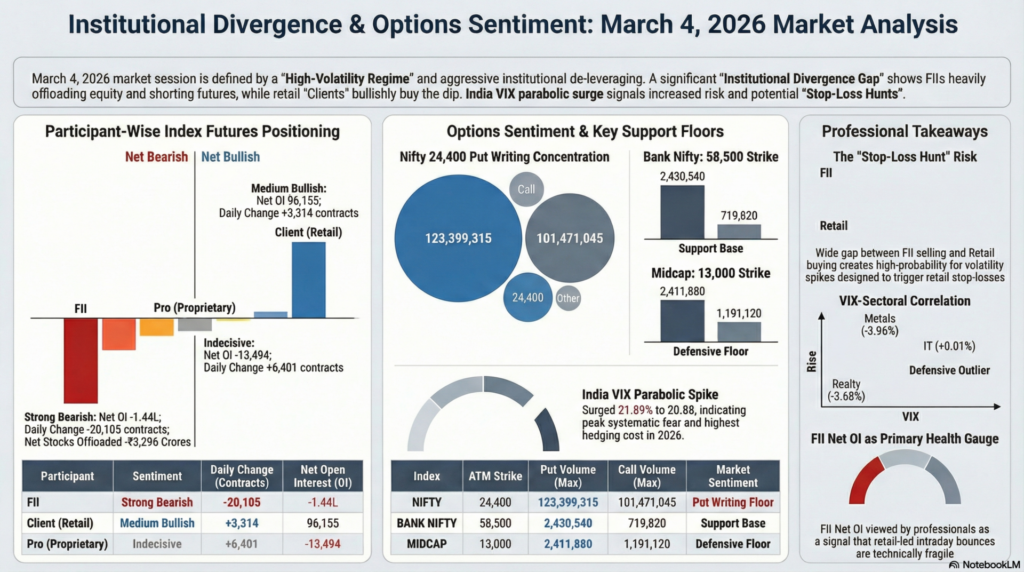
| Participant | Index Futures | sentiment | Net OI | Daily Change |
| FII | -1.44L | Strong Bearish | — | -20,105 |
| Client | 96,155 | Medium Bullish | — | +3,314 |
| Pro | -13,494 | Indecisive | — | +6,401 |
| Index | ATM Strike | Put Volume (Max) | Call Volume (Max) | Market Sentiment |
| NIFTY | 24,400 | 123,399,315 | 101,471,045 | Put Writing Floor |
| BANK NIFTY | 58,500 | 2,430,540 | 719,820 | Support Base |
| MIDCAP | 13,000 | 2,411,880 | 1,191,120 | Defensive Floor |
Technical Analysis: The Nifty option chain exhibits a concentration of Put writing at the 24,400 strike (123M volume), suggesting that traders are attempting to defend this floor. However, the FII Index Future change of -20,105 contracts is a “Super-Bearish” technical signal, indicating that foreign institutions are aggressively shorting the index while retail (Clients) adds +3,314 long contracts.
Fundamental Analysis: Institutional behavior exhibits a sharp “Transfer of Risk.” With FIIs selling -₹3,296 Crores in the cash market and maintaining “Strong Bearish” bias across Nifty and Bank Nifty futures, the fundamental floor is entirely dependent on domestic proprietary desks (Pro) and retail buyers.
| Instrument | Price | Day Change (%) | Technical Status | Headline Sentiment |
| Bitcoin (BTC) | $69,414.99 | +1.58% | Reclaiming Support | Selective Demand |
| Ethereum (ETH) | $2,005.8 | +1.15% | Bullish Breakout | Post-Correction Bid |
| GOLD (XAUUSD) | $5,170.93 | +1.61% | Safe Haven Breakout | Bullish Momentum |
| SILVER | $84.930 | +3.58% | Parabolic Surge | Industrial/Safety Demand |
| BRENT CRUDE | $82.535 | +1.81% | Bullish Pivot | Supply Concern Hedge |
| NATGAS | $3.078 | +0.03% | Sideways Neutral | Inventory Stability |
Technical Analysis: Commodities are the star performers in a “Risk-Off” environment, led by a parabolic 3.58% surge in Silver and a 1.61% breakout in Gold. This technical breakout in hard assets suggests that capital is fleeing currency de-valuation. In the crypto market, Bitcoin is undergoing a period of “Short Squeeze” potential near $66,500, with long distances reaching +1.32%.
Fundamental Analysis: The crypto market sentiment is shifting toward “Greed” as Bitcoin (+1.58%) tracks the safe-haven demand of precious metals. The primary fundamental headwind for the energy complex is the EIA Crude Oil Stocks Change (+2.2M actual vs 15.989M prior), indicating a stabilizing inventory level compared to the previous session’s massive glut.
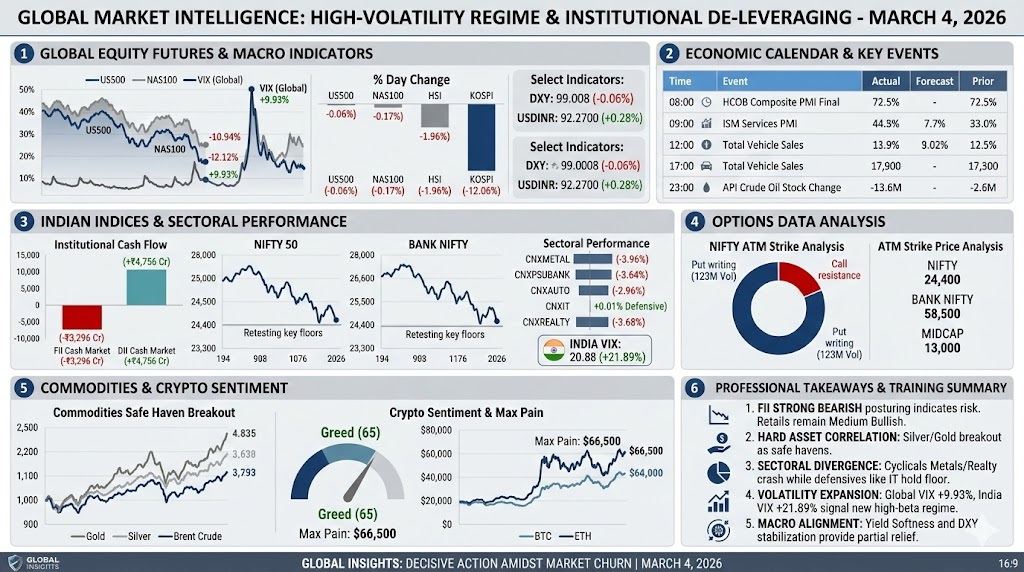
For educational and training purposes, today’s session highlights the “Institutional Divergence Gap.” When FIIs exhibit “Strong Bearish” signals in both Cash (-₹3,296 Cr) and Index Futures (-20,105 daily change) but retail (Clients) maintains a “Medium Bullish” stance, it creates a high-probability environment for a “Stop-Loss Hunt”. For a trainee trader, the key lesson is the VIX-Sectoral Correlation; the India VIX surged 21.89% while cyclical sectors like Metals and Realty fell nearly 4%, proving that volatility spikes primarily impact high-leverage sectors while defensives like IT remain unscathed.
Secondly, the “Hard Asset Hedge” (Silver +3.58%, Gold +1.61%) serves as a definitive professional signal of capital rotation. When equities de-leverage (KOSPI -12%), money traditionally migrates to “Real Value” to escape currency debasement. For a professional analyst, the takeaway is absolute: use the “FII Net OI” as your primary health gauge; as long as FIIs maintain a “Strong Bearish” posture with -1.44L net contracts, the structural downside in India remains technically intact despite any intraday retail-led bounces.
Legal Disclaimer & Liability Waiver – aiTrendview.com
All content, reports, signals, analytics, forecasts, and materials published on aiTrendview.com are fully AI-generated outputs produced through automated systems with zero human research, manual validation, editorial review, or professional intervention. This platform does not provide financial, investment, trading, legal, tax, or professional advice of any kind. aiTrendview.com, its owners, affiliates, and associated entities are not registered with SEBI or any other regulatory authority as investment advisors, research analysts, brokers, or financial consultants. All data is autonomously aggregated from publicly available sources and algorithmic processes that may contain inaccuracies, delays, omissions, or technical errors. Users are solely and exclusively responsible for independently verifying all information before making any financial, legal, or commercial decisions.
By accessing or using this platform, you expressly acknowledge and agree that any reliance on the information provided is entirely at your own risk. aiTrendview.com assumes absolutely no liability for any direct, indirect, incidental, consequential, financial, legal, trading, or other losses arising from the use of, reliance upon, or inability to use any content or data published. Nothing on this platform shall be construed as a solicitation, endorsement, or recommendation to buy, sell, hold, or speculate in any security, derivative, commodity, cryptocurrency, or financial instrument. All intellectual property, including but not limited to algorithms, report structures, proprietary formats, branding, and system outputs, is strictly protected under applicable intellectual property laws. Unauthorized reproduction, redistribution, modification, or commercial exploitation is strictly prohibited and may result in civil and criminal legal action.