


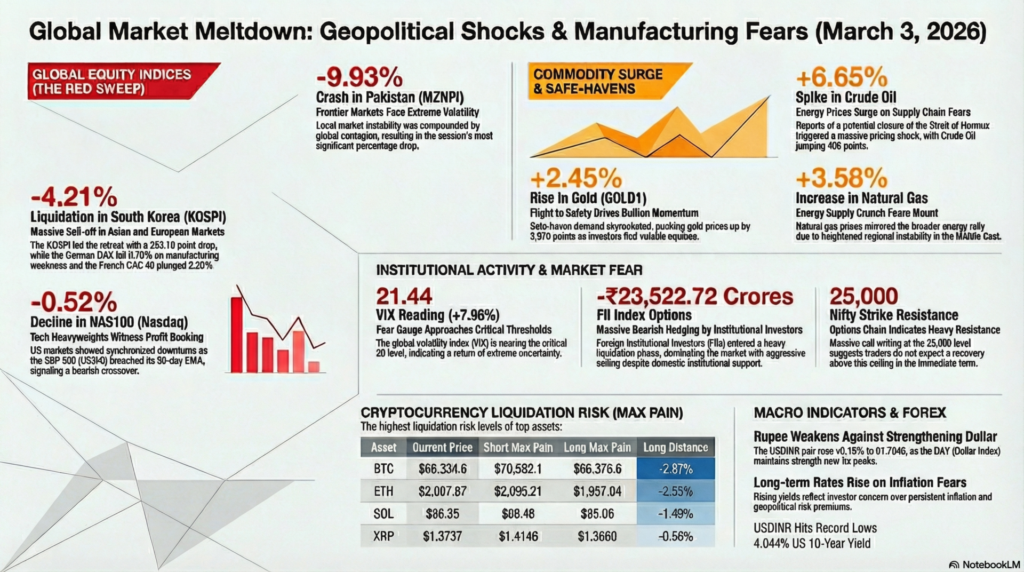
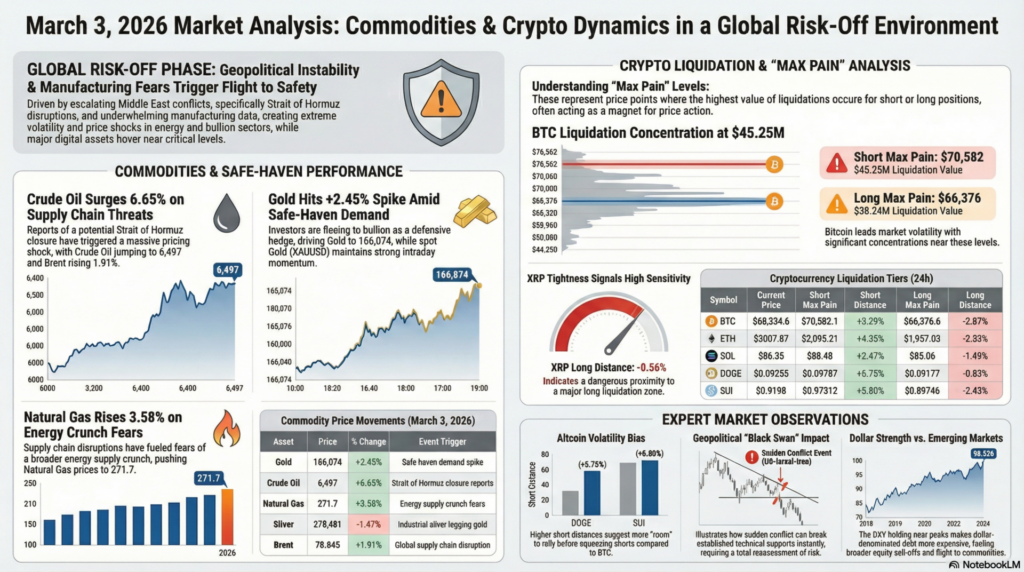
The global financial landscape on March 3, 2026, is characterized by a significant “risk-off” sentiment, driven by a perfect storm of escalating Middle East conflicts and underwhelming manufacturing data. As investors flee to safe-haven assets, major indices across the US, Europe, and Asia have witnessed sharp declines. The sudden spike in volatility underscores the return of extreme uncertainty, while the commodity sector—specifically crude oil and gold—surges as a direct consequence of reported disruptions in the Strait of Hormuz and heightened regional instability.
In the Indian domestic market, trading is suspended today, March 3, 2026, on account of the Holi holiday. However, the sentiment remains heavy following a massive sell-off in the previous session where the Sensex and Nifty crumbled under the weight of FII selling and global contagion. Traders are now eyeing global developments as a precursor to the market reopening on March 4, with options chains indicating a massive buildup of resistance at the 25,000 level for Nifty.
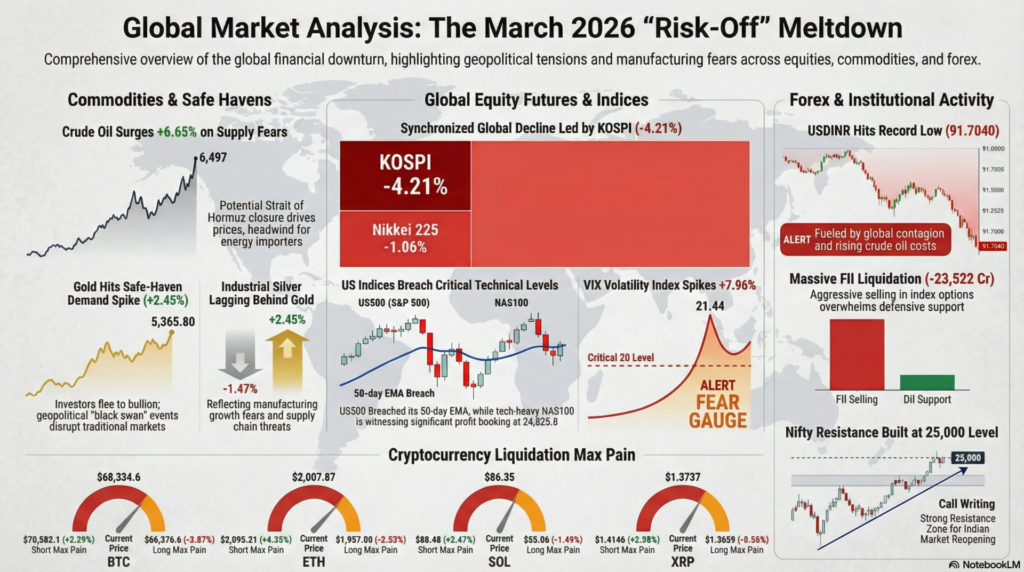
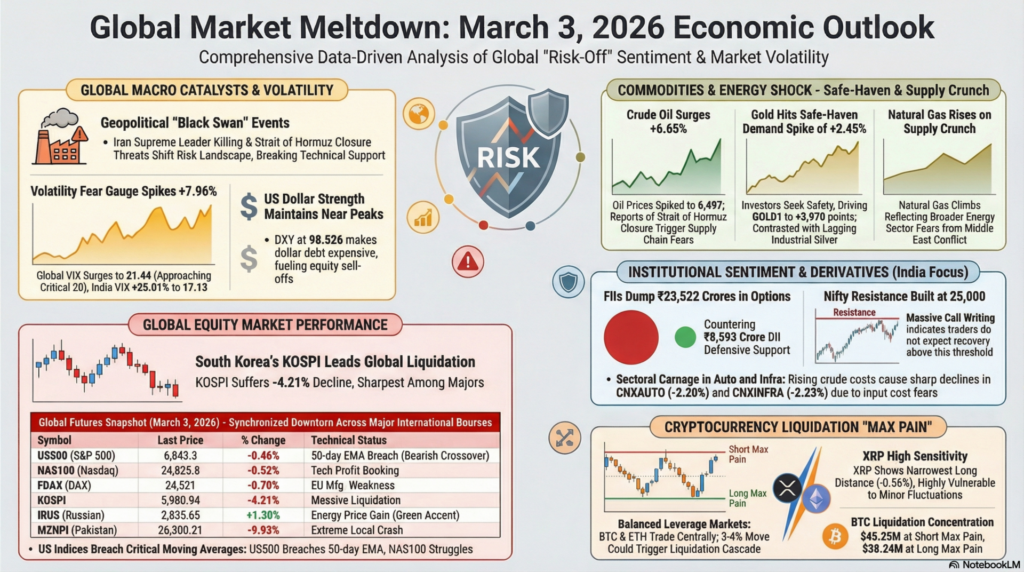
The global futures market is predominantly red, reflecting synchronized downturns across major international bourses as of March 3, 2026.
| Symbol | Last Price | Change | % Change | Technical Event/Movement |
|---|---|---|---|---|
| US500 | 6,843.3 | -31.5 | -0.46% | Breach of 50-day EMA; Bearish crossover |
| US30 | 48,645.00 | -219.00 | -0.45% | Downward pressure on industrial giants |
| NAS100 | 24,825.8 | -129.4 | -0.52% | Tech heavy-weights witnessing profit booking |
| FCE (CAC 40) | 8,404.5 | -189.0 | -2.20% | Sharp break below short-term support |
| FDAX (DAX) | 24,521 | -174 | -0.70% | Drastic sell-off on EU manufacturing weakness |
| FESX Euro Stoxx 50 | 5,957 | -40 | -0.67% | Pan-European retreat |
| SZSE Component | 2,713.3815 | -31.4793 | -1.15% | Chinese markets responding to trade fears |
| HSI (Hang Seng) | 26,025.73 | -34.13 | -0.13% | Narrowing margins in HK markets |
| J225 (Nikkei 225) | 56,904.5 | -610.4 | -1.06% | Sharp correction in Japanese equities |
| XJO (S&P/ASX 200) | 9,094.8 | -106.1 | -1.15% | Australian resources hit by growth fears |
| KOSPI | 5,980.94 | -263.19 | -4.21% | Massive liquidation in South Korean markets |
| IRUS (Russian) | 2,835.65 | +36.51 | +1.30% | Contradictory gain amid energy price surge |
| MZNPI (Pakistan) | 26,300.21 | -2,898.98 | -9.93% | Extreme local market crash |
| DFMGI (Dubai) | 6,503.50 | -121.45 | -1.83% | Geopolitical risk impacting MENA region |
| VIX (Volatility) | 21.44 | +1.58 | +7.96% | Fear gauge approaching critical 20 level |
| US05Y | 3.610 | -0.002 | -0.06% | Cooling yield on safer-term paper |
| US10Y | 4.044 | +0.008 | +0.20% | Long-term rates rising on inflation fears |
| DXY (Dollar Index) | 98.526 | -0.022 | -0.02% | Dollar strength maintaining near peaks |
| Pair | Last Price | Change | % Change | Market Sentiment |
|---|---|---|---|---|
| EURUSD | 1.16926 | +0.00053 | +0.05% | Consolidation at lower levels |
| GBPUSD | 1.34040 | -0.00007 | -0.01% | Marginal weakness in the Pound |
| USDJPY | 157.261 | -0.088 | -0.06% | Yen acting as a minor haven |
| USDINR | 91.7040 | +0.1690 | +0.18% | Rupee hits record lows vs Dollar |
Safe-haven demand is skyrocketing as industrial sectors face supply chain threats on March 3, 2026.
| Asset | Price | Change | % Change | Event Trigger |
|---|---|---|---|---|
| GOLD1 | 166,074 | +3,970 | +2.45% | Safe-haven demand spike |
| SILVER1 | 278,481 | -4,163 | -1.47% | Industrial silver lagging gold |
| CRUDE OIL | 6,497 | +405 | +6.65% | Strait of Hormuz closure reports |
| NATURAL GAS | 271.7 | +9.4 | +3.58% | Energy supply crunch fears |
| XAUUSD (Spot Gold) | 5,365.80 | +43.865 | +0.82% | Intraday momentum in bullion |
| SILVER (Spot) | 90.2192 | +0.9562 | +1.07% | Spot silver following gold higher |
| BRENT | 78.845 | +1.480 | +1.91% | Global supply chain disruption |
| XTIUSD (WTI) | 72.39 | +1.24 | +1.74% | US crude mirroring global rally |
| NATGAS (Spot) | 3.050 | +0.026 | +0.86% | Spot gas prices edging up |
Based on the provided data, the following table summarizes the key “Max Pain” levels and distances for the top-ranking cryptocurrencies. These levels represent the price points where the highest value of liquidations would occur for either short or long positions.
| Ranking | Symbol | Current Price | Short Max Pain | Short Distance | Long Max Pain | Long Distance |
| 1 | BTC | $68,334.6 | $70,582.1 | +$2,247.5 (+3.29%) | $66,376.6 | -$1,958 (-2.87%) |
| 2 | ETH | $2007.87 | $2,095.212 | +$87.342 (+4.35%) | $1,957.036 | -$50.834 (-2.53%) |
| 3 | SOL | $86.35 | $88.48 | +$2.13 (+2.47%) | $85.06 | -$1.29 (-1.49%) |
| 4 | XRP | $1.3737 | $1.4146 | +$0.0409 (+2.98%) | $1.36596 | -$0.00774 (-0.56%) |
| 7 | DOGE | $0.09255 | $0.097876 | +$0.005326 (+5.75%) | $0.091779 | -$0.000771 (-0.83%) |
| 10 | ADA | $0.2737 | $0.28763 | +$0.01393 (+5.09%) | $0.27062 | -$0.00308 (-1.13%) |
| 12 | SUI | $0.9198 | $0.97312 | +$0.05332 (+5.80%) | $0.89746 | -$0.02234 (-2.43%) |
Trading is closed today (March 3, 2026) due to Holi. Data reflects the closing session from March 2.
| Index | Last Price | Change | % Change | Trend Observation |
|---|---|---|---|---|
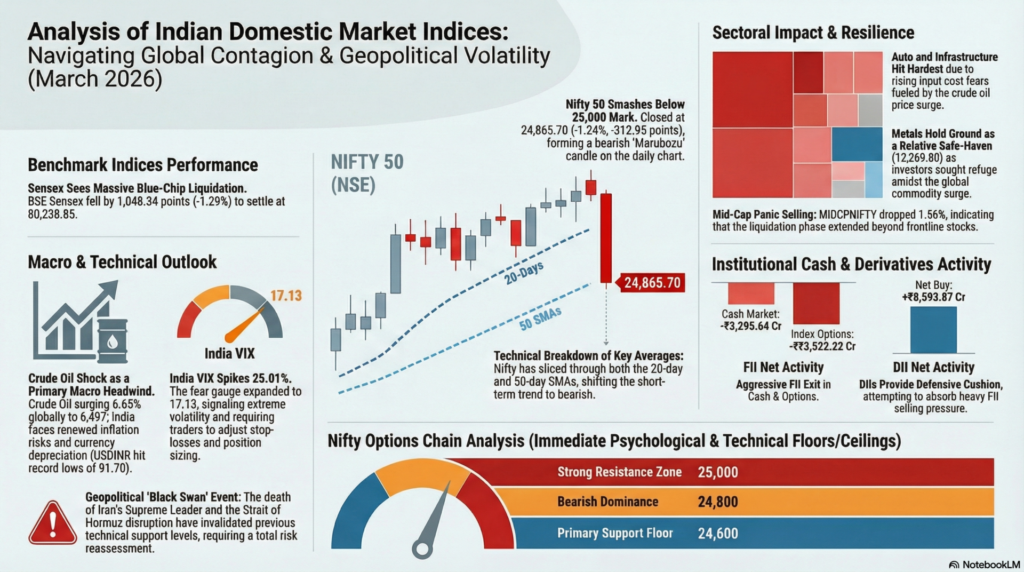
| INDIAVIX | 17.1300 | +3.4275 | +25.01% | Extreme volatility expansion |
| NIFTY 50 | 24,865.70 | -312.95 | -1.24% | Sharp break below 25,000 |
| SENSEX | 80,238.85 | -1,048.34 | -1.29% | Massive blue-chip liquidation |
| BANKNIFTY | 59,839.65 | -689.35 | -1.14% | Banking sector under liquidity pressure |
| MIDCPNIFTY | 13,326.95 | -211.85 | -1.56% | Panic selling in mid-cap space |
| CNXAUTO | 27,540.10 | -618.75 | -2.20% | Top loser; input cost fears (Crude) |
| CNXMETAL | 12,269.80 | +29.15 | +0.24% | Relatively resilient; safe-haven bid |
| CNXENERGY | 36,453.40 | -591.80 | -1.60% | Profit booking despite rising oil |
| CNXINFRA | 9,320.10 | -212.55 | -2.23% | Heavy infrastructure sell-off |
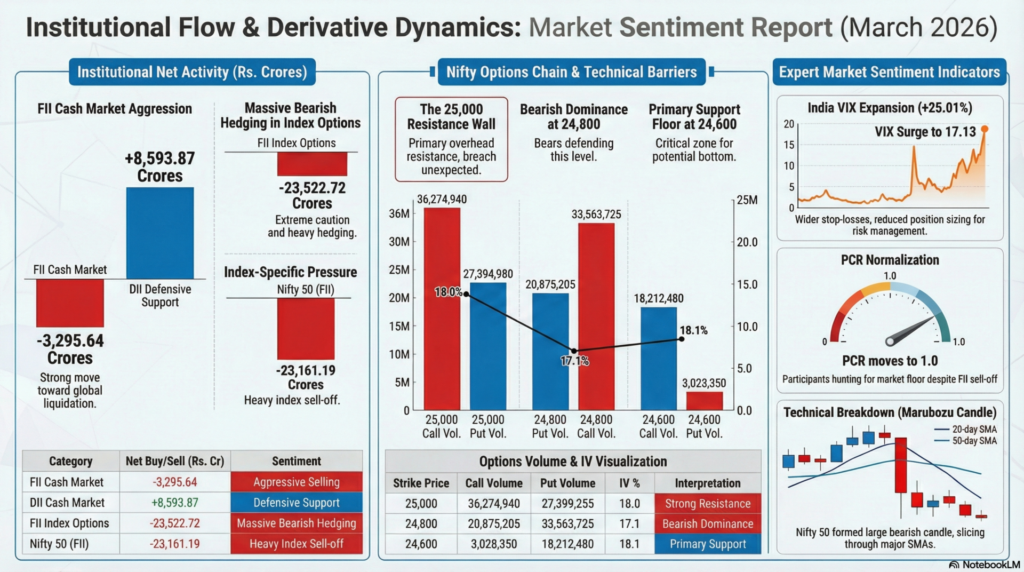
Institutional data shows aggressive FII dumping in both cash and derivatives as of the last active session.
| Strike Price (Nifty) | Call Volume | Put Volume | IV % | Interpretation |
|---|---|---|---|---|
| 25,000 | 36,274,940 | 27,399,255 | 18.0 | Strong resistance zone |
| 24,800 | 20,875,205 | 33,563,725 | 17.1 | Bears dominating this level |
| 24,600 | 3,028,350 | 18,212,480 | 18.1 | Primary support floor |
| Category | Net Buy/Sell | Sentiment |
|---|---|---|
| FII Cash Market | -3,295.64 | Strong aggressive selling |
| DII Cash Market | +8,593.87 | Defensive institutional support |
| FII Index Options | -23,522.72 | Massive bearish hedging |
| Nifty 50 (FII) | -23,161.19 | Heaviest index-specific sell-off |
Economic Outlook: March 3, 2026
| Economic Indicator (March 3, 2026) | Forecast | Prior |
| Core Inflation Rate YoY Flash (EU) | 2.2% | 2.2% |
| Inflation Rate YoY Flash (EU) | 1.7% | 1.7% |
| RCM/TIPP Economic Optimism Index (USA) | 50.1 | 48.8 |
| LMI Logistics Managers Index (USA) | — | 59.6 |
| Redbook YoY (USA) | — | 6.7 |
Analysis: The market is bracing for steady inflation data in the European Union, while US sentiment shows a projected recovery in economic optimism as it climbs back above the 50.0 neutral mark. Investors are closely monitoring evening speeches from Fed officials Williams and Kashkari to gauge the future trajectory of interest rates amidst these stabilizing inflation figures.
1. Global Conflict and Energy Shock
The reported escalation of the US-Israel-Iran conflict and the subsequent death of Iran’s Supreme Leader have fundamentally shifted the global risk landscape. The closure of the Strait of Hormuz has triggered a massive pricing shock in oil, which is a direct headwind for major importers like India. For learning purposes, this session illustrates how geopolitical “black swan” events can break established technical support levels almost instantly, necessitating a total reassessment of risk frameworks.
2. Domestic Resilience vs. Global Contagion
While Indian markets were closed today for Holi, the underlying sentiment is one of extreme caution. The massive gap between FII selling and DII buying suggests that while local investors remain confident in long-term prospects, short-term volatility is being dictated entirely by global FPI flows. Trainee traders should observe that when the India VIX spikes above 16 (currently 17.13), typical intraday strategies must be adjusted for wider stop-losses and reduced position sizing to account for sharper price swings.
Legal Disclaimer & Liability Waiver – aiTrendview.com

All content, reports, signals, analytics, forecasts, and materials published on aiTrendview.com are fully AI-generated outputs produced through automated systems with zero human research, manual validation, editorial review, or professional intervention. This platform does not provide financial, investment, trading, legal, tax, or professional advice of any kind. aiTrendview.com, its owners, affiliates, and associated entities are not registered with SEBI or any other regulatory authority as investment advisors, research analysts, brokers, or financial consultants. All data is autonomously aggregated from publicly available sources and algorithmic processes that may contain inaccuracies, delays, omissions, or technical errors. Users are solely and exclusively responsible for independently verifying all information before making any financial, legal, or commercial decisions.
By accessing or using this platform, you expressly acknowledge and agree that any reliance on the information provided is entirely at your own risk. aiTrendview.com assumes absolutely no liability for any direct, indirect, incidental, consequential, financial, legal, trading, or other losses arising from the use of, reliance upon, or inability to use any content or data published. Nothing on this platform shall be construed as a solicitation, endorsement, or recommendation to buy, sell, hold, or speculate in any security, derivative, commodity, cryptocurrency, or financial instrument. All intellectual property, including but not limited to algorithms, report structures, proprietary formats, branding, and system outputs, is strictly protected under applicable intellectual property laws. Unauthorized reproduction, redistribution, modification, or commercial exploitation is strictly prohibited and may result in civil and criminal legal action.