


The global financial landscape on March 2, 2026, is characterized by a significant “risk-off” sentiment, driven by a perfect storm of escalating Middle East conflicts and underwhelming manufacturing data. As investors flee to safe-haven assets, major indices across the US, Europe, and Asia have witnessed sharp declines. The sudden spike in the India VIX by over 20% underscores the return of extreme volatility, while the commodity sector—specifically crude oil and gold—surges as a direct consequence of the reported closure of the Strait of Hormuz and heightened regional instability.
In the Indian domestic market, the Nifty 50 and Sensex have crumbled under the weight of FII selling and global contagion, breaching key support levels. Despite strong Domestic Institutional Investor (DII) support in previous sessions, the sheer volume of global panic has overwhelmed local resilience. Traders are now eyeing the $24,500$ level for Nifty as the final line of defense, while the options chain indicates a massive buildup of resistance at $25,000$. This blog breaks down the data across every major asset class to provide a clear roadmap for this turbulent start to March.
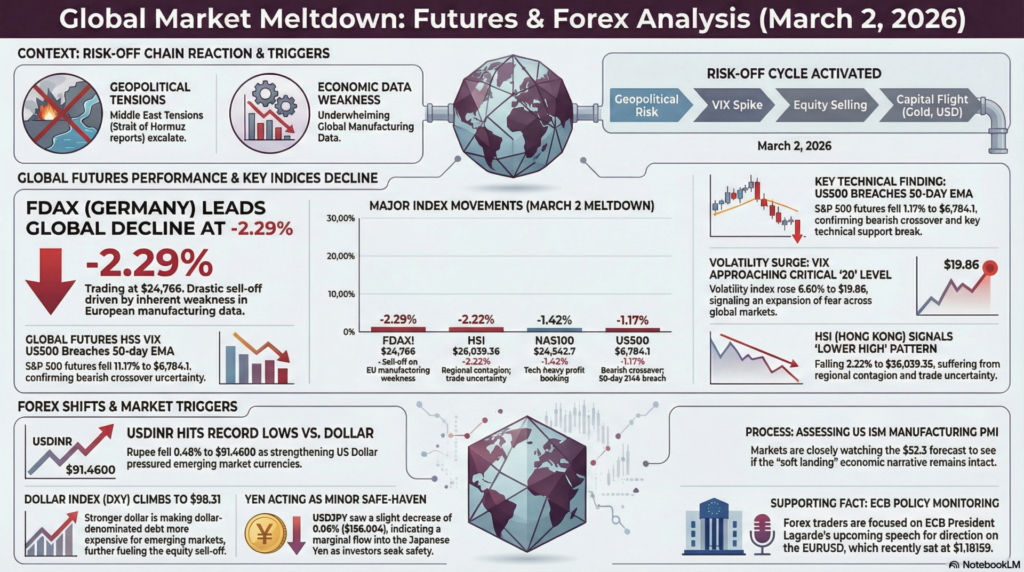
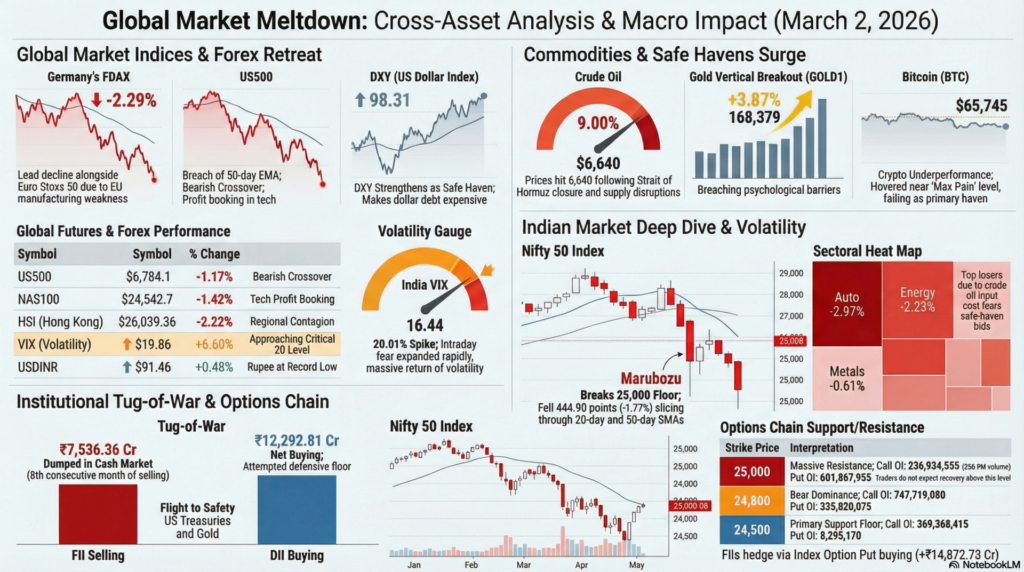
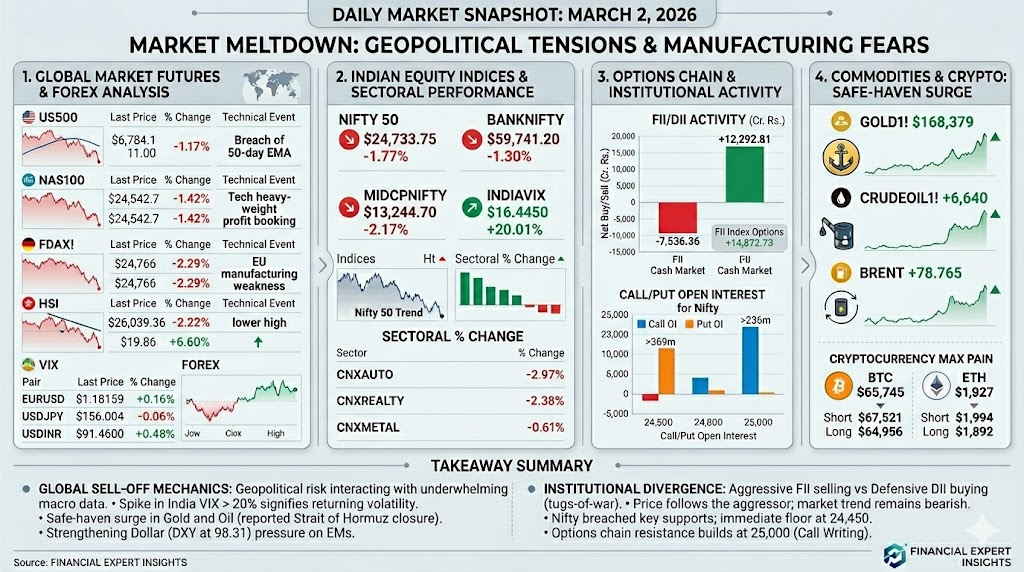
The global futures market is painted red, with European indices like the FDAX and FESX leading the decline with drops exceeding 2%. The US dollar continues to strengthen as a safe haven, putting immense pressure on emerging market currencies like the Indian Rupee (INR).
| Symbol | Last Price | Change | % Change | Technical Event/Movement |
| US500 | $6,784.1 | -80.4 | -1.17\% | Breach of 50-day EMA; Bearish crossover |
| NAS100 | $24,542.7 | -354.3 | -1.42\% | Tech heavy-weights witnessing profit booking |
| FDAX! (Germany) | $24,766 | -581 | -2.29\% | Drastic sell-off on EU manufacturing weakness |
| HSI (Hong Kong) | $26,039.36 | -591.19 | -2.22\% | Regional contagion and trade uncertainty |
| VIX (Volatility) | $19.86 | +1.23 | +6.60\% | Fear gauge approaching the critical 20 level |
| Pair | Last Price | Change | % Change | Market Sentiment |
| EURUSD | $1.18159 | +0.00187 | +0.16\% | ECB Lagarde speech monitoring |
| USDJPY | $156.004 | -0.086 | -0.06\% | Yen acting as a minor haven |
| USDINR | $91.4600 | +0.4340 | +0.48\% | Rupee hits record lows vs Dollar |
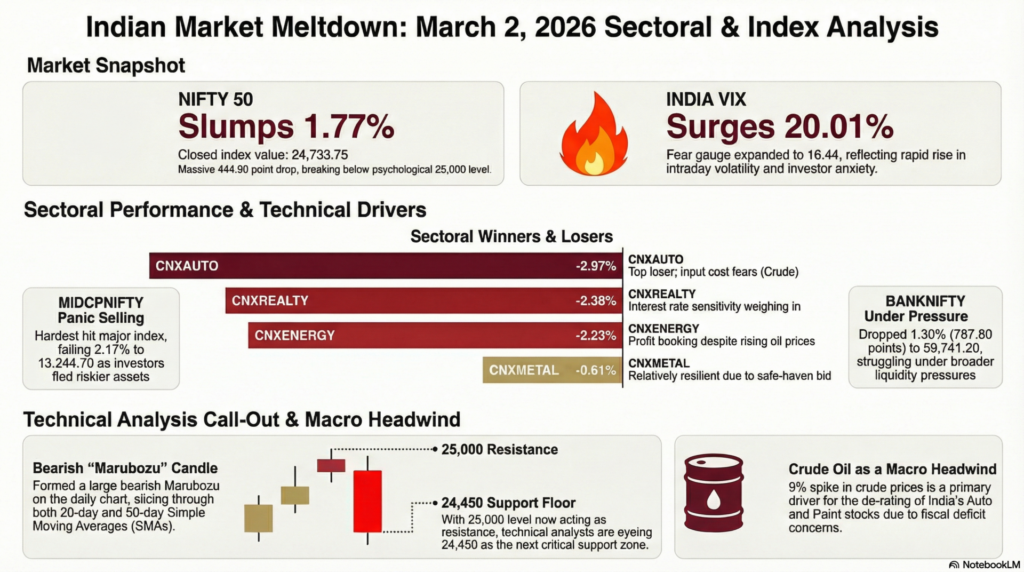
The Indian market opened with a massive gap-down, with the Nifty falling nearly 450 points. The India VIX surged to $16.44$, reflecting a $20\%$ spike in intraday fear.
| Index | Last Price | Change | % Change | Current Trend |
| NIFTY 50 | 24,733.75 | -444.90 | -1.77\% | Sharp break below $25,000$ |
| BANKNIFTY | 59,741.20 | -787.80 | -1.30\% | Banking sector under liquidity pressure |
| MIDCPNIFTY | 13,244.70 | -294.10 | -2.17\% | Panic selling in mid-cap space |
| INDIAVIX | 16.4450 | +2.7425 | +20.01\% | Extreme volatility expansion |
| Sector | Change | % Change | Technical Observation |
| CNXAUTO | $-836.45$ | $-2.97\%$ | Top loser; input cost fears (Crude) |
| CNXREALTY | $-18.60$ | $-2.38\%$ | Interest rate sensitivity weighing in |
| CNXMETAL | $-75.00$ | $-0.61\%$ | Relatively resilient due to safe-haven bid |
| CNXENERGY | $-825.20$ | $-2.23\%$ | Profit booking despite rising oil prices |
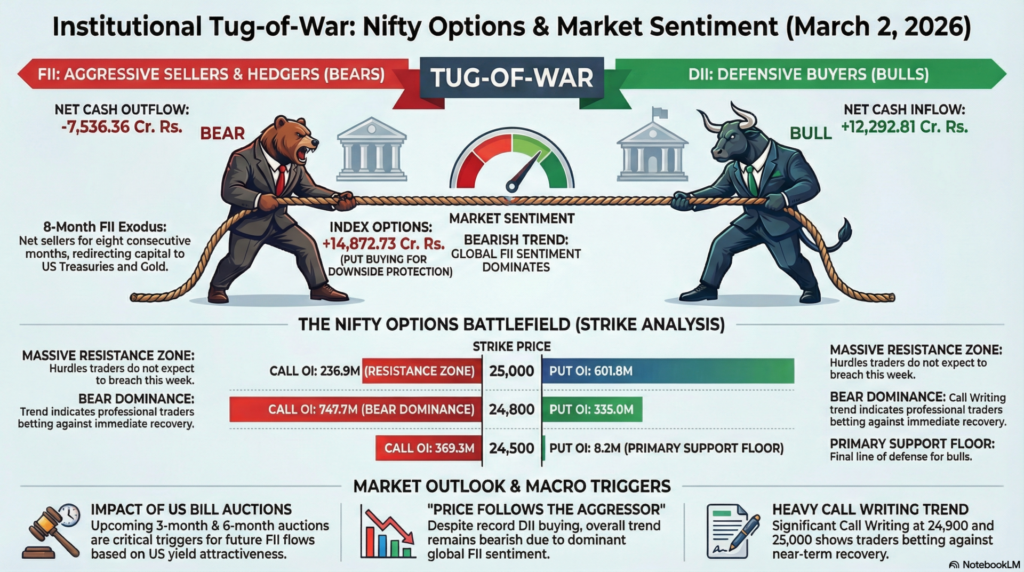
Institutional data shows a stark divide: FIIs continue to dump cash market holdings, while DIIs are desperately trying to provide a floor.
| Category | Net Buy/Sell | Market Sentiment |
| FII Cash Market | -7,536.36 | Strong aggressive selling |
| DII Cash Market | +12,292.81 | Massive defensive buying |
| FII Index Options | +14,872.73 | Hedging via Put buying |
| Strike Price | Call OI (Volume) | Put OI (Volume) | Interpretation |
| 25,000 | 236,934,555 | 601,867,955 | Massive resistance zone |
| 24,800 | 747,719,050 | 335,020,075 | Bears dominating the 24,800 level |
| 24,500 | 369,368,415 | 8,295,170 | Primary support floor |
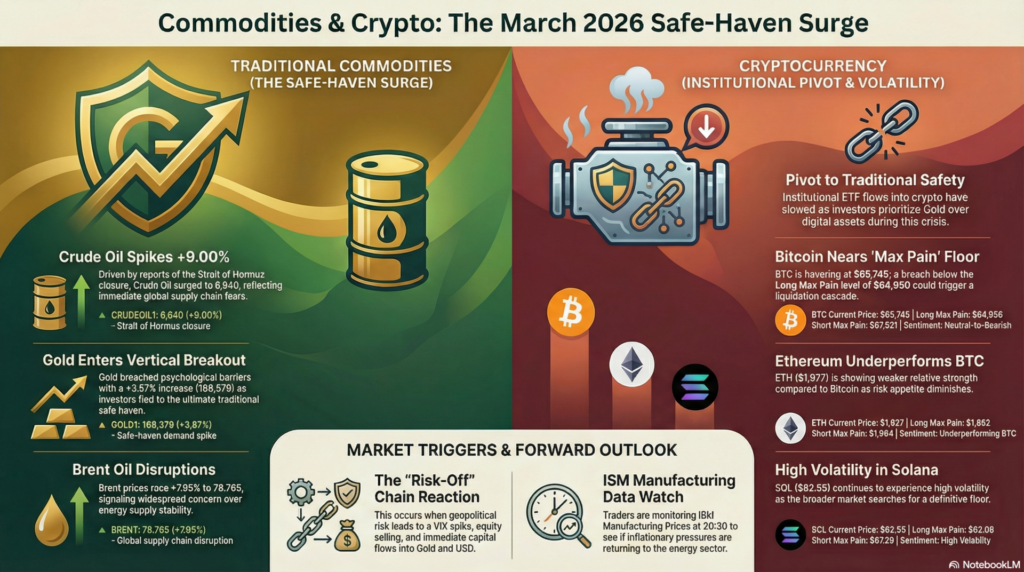
While equities bleed, the COMEX market is on fire. Crude oil has spiked by $9\%$ following geopolitical escalations, and Gold has breached psychological barriers.
| Asset | Price | Change | % Change | Event Trigger |
| GOLD1 | 168,379 | +6,275 | +3.87% | Safe-haven demand spike |
| CRUDEOIL1 | 6,640 | +548 | +9.00% | Strait of Hormuz closure reports |
| BRENT | 78.765 | +5.800 | +7.95% | Global supply chain disruption |
| Symbol | Price | Short Max Pain | Long Max Pain | Sentiment |
| BTC | $65,745 | 67,521 | 64,956 | Neutral-to-Bearish |
| ETH | $1,927 | 1,994 | 1,892 | Underperforming BTC |
| SOL | $82.55 | 87.29 | 82.06 | High volatility |
1. The Mechanics of a Global Sell-off:
This session provides a textbook example of how geopolitical risk (Strait of Hormuz/Middle East) interacts with macro data (PMI/Inflation). When uncertainty rises, the “Risk-Off” chain reaction occurs: (a) VIX spikes, (b) Investors sell Equities (Nifty/US500), (c) Capital flows into Havens (Gold/USD), and (d) Energy prices surge due to supply fears. Understanding the correlation between a rising DXY and falling Emerging Market indices (Nifty) is crucial for any trader’s macro-outlook.
2. Analyzing Institutional Divergence:
The data shows a massive tug-of-war. FIIs are selling aggressively ($-7.5k$ Cr), yet DIIs are buying even more $(+12.2k$ Cr). While DII support prevents a total market collapse, it rarely leads to a rally without FII participation. Traders should learn that Price follows the aggressor; currently, despite DII buying, the price trend remains bearish because the global FII sentiment is dominant. Keep a close eye on the “Options Max Pain”—when the market trades significantly away from it, a violent mean reversion or a massive liquidation is usually imminent.
Legal Disclaimer & Liability Waiver
This AI-generated report is strictly educational and does not constitute financial, legal, or professional advice. aiTrendview and its affiliates are not SEBI-registered advisors and assume zero liability for any losses or consequences resulting from its use. All data is autonomously harvested from public sources and may be flawed, delayed, or incomplete; therefore, you assume exclusive responsibility for independently verifying information before taking any action. Under no circumstances should this content be construed as a recommendation to trade or speculate in any security. By accessing this material, you acknowledge that any reliance on this data is at your sole risk, and you agree to be bound by strict intellectual property protections prohibiting the unauthorized redistribution or modification of this work.


