


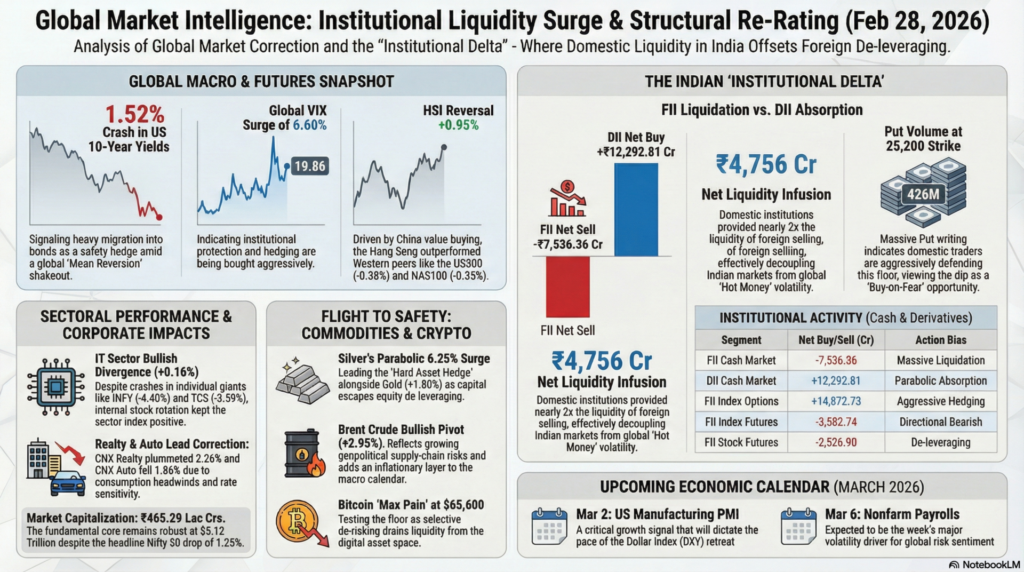
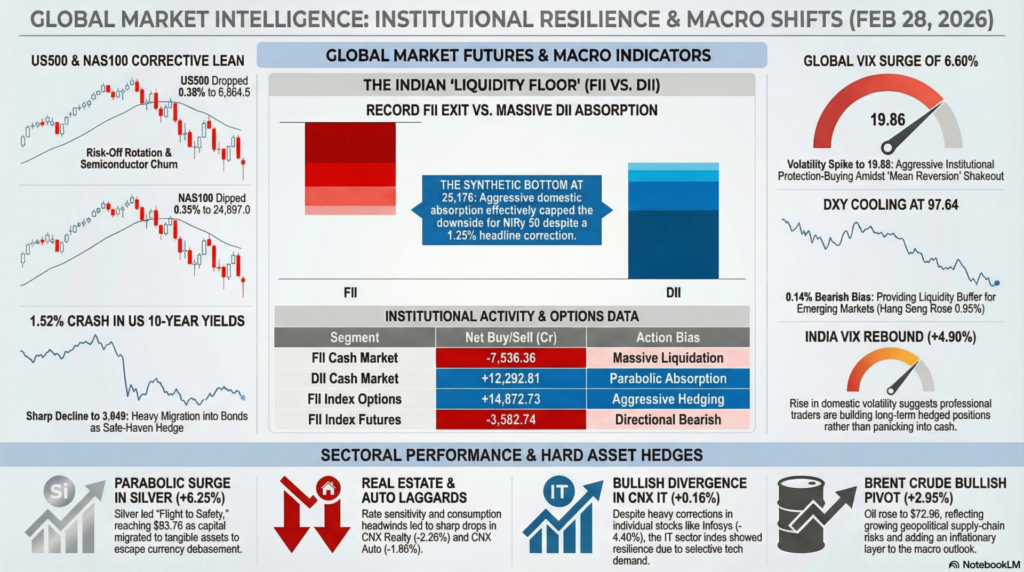
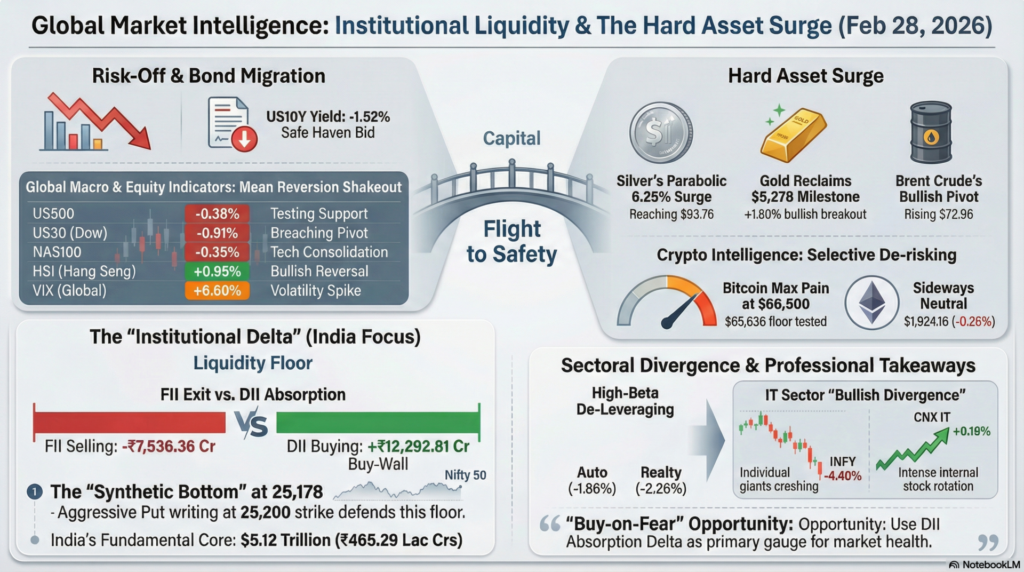
The global financial landscape on February 28, 2026, exhibits a theme of “Structural Re-Rating” as institutional capital aggressively offsets a localized de-leveraging event in high-beta sectors. While Western futures, including the US500 and NAS100, showed a slight corrective lean (-0.38% and -0.35% respectively), the broader macro environment remains underpinned by a cooling Dollar Index (DXY) at 97.64. This cooling has allowed Asian markets like the Hang Seng (+0.95%) and KOSPI to find footing, even as volatility (VIX) remains at a slightly elevated floor of 19.86. The global narrative is transitioning from a period of broad-based momentum to one of “Institutional Delta,” where big-money players are cherry-picking value amidst selective profit-booking in tech and financials.
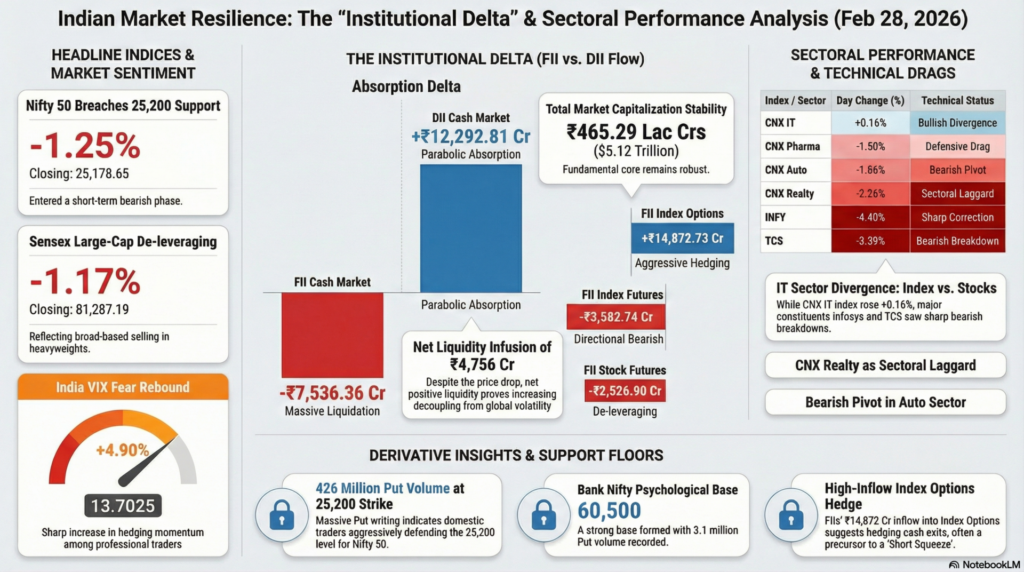
In the Indian domestic market, the session was defined by an unprecedented “Liquidity Floor” provided by Domestic Institutional Investors (DIIs). Despite a sharp headline correction in the Nifty 50 (-1.25%) and Sensex (-1.17%), the internal data reveals a massive synchronized buy-wall. While Foreign Institutional Investors (FIIs) executed a record net sell of -₹7,536.36 Crores, DIIs countered with a staggering +₹12,292.81 Crores inflow. This aggressive domestic absorption effectively capped the downside for the Nifty at the 25,178 level. This structural resilience is being tested by sectoral weakness in Auto (-1.86%) and Realty (-2.26%), though the India VIX rising 4.90% suggests that professional traders are using the dip to build long-term hedged positions rather than panicking into cash.
| Instrument | Price / Rate | Day Change (%) | Technical Movement | Key Event / Driver |
| US500 | 6,864.5 | -0.38% | Testing Support | Risk-Off Rotation |
| US30 | 48,859.00 | -0.91% | Breaching Pivot | Cyclical Drag |
| NAS100 | 24,897.0 | -0.35% | Tech Consolidation | Semi-conductor Churn |
| HSI | 26,630.55 | +0.95% | Bullish Reversal | China Value Buying |
| KOSPI | 6,244.13 | -1.00% | Mean Reversion | High-Beta Shakeout |
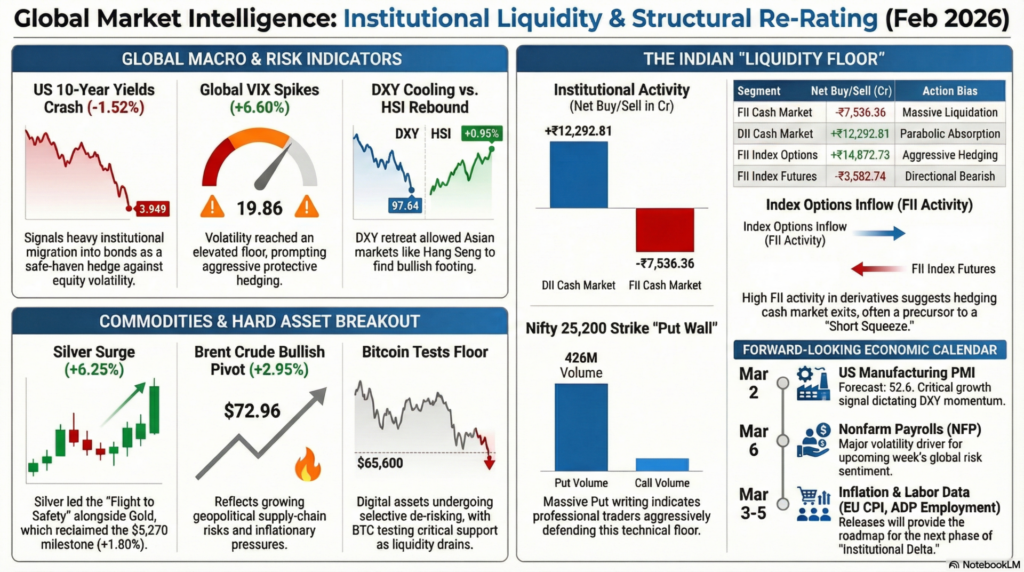
| VIX (Global) | 19.86 | +6.60% | Volatility Spike | Protective Hedging |
| DXY | 97.646 | -0.14% | Bearish Bias | Dollar Weakness |
| US10Y | 3.949 | -1.52% | Safe Haven Bid | Bond Yield Decline |
Technical Analysis: Global indices are undergoing a “Mean Reversion” shakeout, with the 1.52% crash in US 10-Year yields signaling a heavy migration into bonds as a safety hedge. The 6.60% surge in the Global VIX suggests that institutional protection is being bought aggressively, though the DXY’s weakness provides a necessary liquidity buffer for emerging markets.
Fundamental Analysis: The fundamental backdrop is dominated by a shift from growth-seeking to value-preservation. Investors are reacting to a potential “Growth Scare” as cyclicals lead the US30 downward, while the Hang Seng’s 0.95% gain reflects fundamental re-rating of discounted Asian equities.
Economic Announcements: The session is front-loaded with the ISM Manufacturing PMI (Forecast: 52.6) and Consumer Confidence Final (-12.2), which will dictate the pace of the DXY’s retreat and the subsequent relief in emerging market currencies.
| Index / Sector | Last Price | Day Change (%) | Technical Movement | Event / Driver |
| NIFTY 50 | 25,178.65 | -1.25% | Breaching 25,200 | Institutional Hand-off |
| SENSEX | 81,287.19 | -1.17% | Breaching 81.3k | Large-Cap De-leveraging |
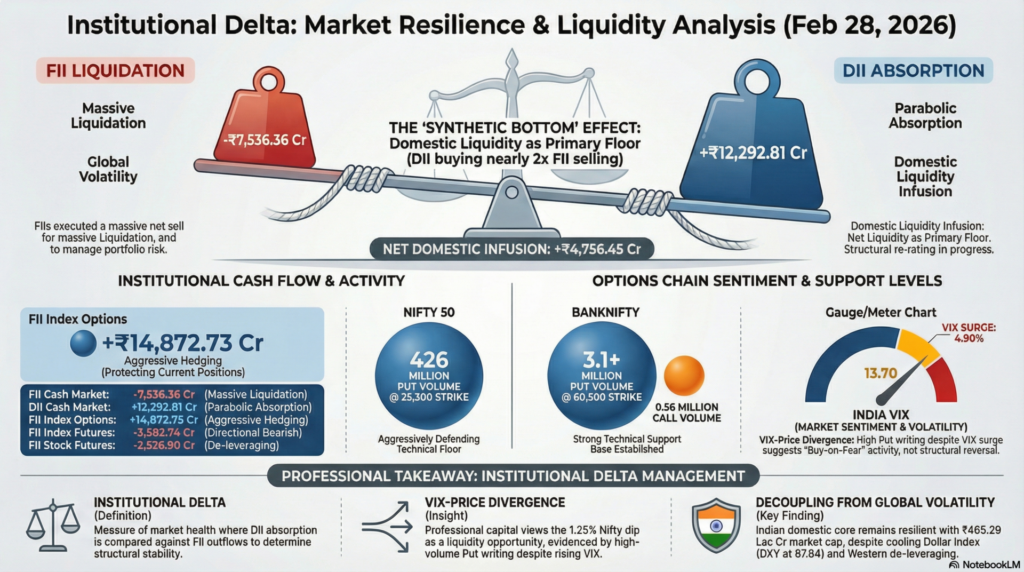
| INDIA VIX | 13.7025 | +4.90% | Fear Rebound | Hedging Momentum |
| CNX AUTO | 28,158.85 | -1.86% | Bearish Pivot | Consumption Headwinds |
| CNX REALTY | 780.60 | -2.26% | Sectoral Laggard | Rate Sensitivity |
| CNX PHARMA | 22,952.35 | -1.50% | Defensive Drag | Profit Booking |
| CNX IT | 30,603.85 | +0.16% | Bullish Divergence | Selective Tech Demand |
| INFY | 1,269.10 | -4.40% | Sharp Correction | Earnings Skepticism |
| TCS | 2,580.10 | -3.59% | Bearish Breakdown | Institutional Exit |
Technical Analysis: The Nifty 50 has entered a short-term bearish phase, breaching the 25,200 support. The 4.40% crash in Infosys (INFY) is the primary technical weight, suggesting that the “IT Growth” narrative is being aggressively re-priced downward.
Fundamental Analysis: Despite the headline sell-off, India’s fundamental core remains robust with the Market Capitalization standing at ₹465.29 Lac Crs ($5.12 Trillion). The outperformance of the IT sector index (+0.16%) against individual crashes in INFY and TCS suggests a high degree of internal stock rotation.
| Segment | Net Buy/Sell (Cr) | Action Bias |
| FII Cash Market | -7,536.36 | Massive Liquidation |
| DII Cash Market | +12,292.81 | Parabolic Absorption |
| FII Index Options | +14,872.73 | Aggressive Hedging |
| FII Index Futures | -3,582.74 | Directional Bearish |
| FII Stock Futures | -2,526.90 | De-leveraging |
| Index | ATM Strike | Put Volume (Max) | Call Volume (Max) | Market Sentiment |
| NIFTY | 25,200 | 426,279,165 | 124,257,315 | Put Writing Support |
| BANKNIFTY | 60,500 | 3,160,620 | 566,310 | Strong Base |
| MIDCAP SELECT | 13,500 | 1,642,680 | 975,480 | Support Heavy |
Technical Analysis: The Nifty option chain exhibits massive Put writing at the 25,200 strike (426M volume), indicating that domestic traders are aggressively defending this floor. In Bank Nifty, the concentration of 3.1M Put volume at 60,500 provides a critical psychological and technical base for the upcoming expiry.
Fundamental Analysis: The “Institutional Delta” is at record levels. The fact that DIIs bought ₹12,292 Cr while FIIs sold ₹7,536 Cr indicates a net liquidity infusion of nearly ₹4,756 Cr into the domestic ecosystem. This fundamental shift proves that Indian markets are becoming increasingly decoupled from global “Hot Money” volatility.
| Instrument | Price | Day Change (%) | Technical Status | Headline Sentiment |
| Bitcoin (BTC) | $65,636.0 | -0.33% | Testing $65k Floor | Selective De-risking |
| Ethereum (ETH) | $1,924.16 | -0.26% | Sideways Neutral | Liquidity Drain |
| GOLD (XAUUSD) | $5,278.51 | +1.80% | Bullish Breakout | Safe Haven Demand |
| SILVER | $93.760 | +6.25% | Parabolic Surge | Industrial Breakout |
| BRENT CRUDE | $72.965 | +2.95% | Bullish Pivot | Supply Risk Hedge |
| NATGAS | $2.903 | +0.69% | Bottoming Out | Mean Reversion |
Technical Analysis: Commodities are leading the “Flight to Safety,” with Silver surging a parabolic 6.25% and Gold reclaiming the $5,270 milestone. This technical breakout in hard assets is a direct consequence of the de-leveraging in equities and crypto. In the digital space, Bitcoin is undergoing “Max Pain” as it tests the $65,600 support.
Fundamental Analysis: The crypto market sentiment is shifting toward “Selective Accumulation,” with Bitcoin Max Pain at $66,500 suggesting that market makers are positioning for a short-term squeeze. The 2.95% jump in Brent Crude fundamentally reflects growing geopolitical supply-chain risks, adding an inflationary layer to the global macro calendar.
For educational and training purposes, today’s session serves as a masterclass in “Institutional Delta Management.” When FIIs exit ₹7,536 Cr but DIIs absorb ₹12,292 Cr, the result is a “Synthetic Bottom”. For a trainee trader, the key lesson is the VIX-Price Divergence; even as the India VIX surged 4.90%, the aggressive Put writing at 25,200 Nifty suggests that professional capital views this as a “Buy-on-Fear” opportunity rather than a structural reversal. The massive ₹14,872 Cr inflow into Index Options by FIIs further indicates they are aggressively using derivatives to hedge their cash market exits, which often precedes a sharp “Short Squeeze”.
Secondly, the “Hard Asset Hedge” (Silver +6.25%, Gold +1.80%) provides a definitive professional signal. When the US 10-Year yield crashes (-1.52%) alongside an equity sell-off, capital traditionally migrates to tangible assets to escape currency debasement. For a professional analyst, the takeaway is absolute: use the “DII Absorption Delta” as your primary health gauge. As long as domestic institutions provide nearly 2x the liquidity of foreign selling, the structural bull market remains technically intact, regardless of high-beta tech corrections in INFY and TCS.
| Date | Event | Market Impact |
|---|---|---|
| Mar 2 | US Manufacturing PMI | Growth signal |
| Mar 3 | EU CPI | Inflation outlook |
| Mar 4 | ADP Employment | Labor market health |
| Mar 5 | Initial Jobless Claims | Economic momentum |
| Mar 6 | Nonfarm Payrolls | Major volatility driver |
These releases are likely to dictate global risk sentiment and capital flows.
Legal Disclaimer & Liability Waiver
This AI-generated report is strictly educational and does not constitute financial, legal, or professional advice. aiTrendview and its affiliates are not SEBI-registered advisors and assume zero liability for any losses or consequences resulting from its use. All data is autonomously harvested from public sources and may be flawed, delayed, or incomplete; therefore, you assume exclusive responsibility for independently verifying information before taking any action. Under no circumstances should this content be construed as a recommendation to trade or speculate in any security. By accessing this material, you acknowledge that any reliance on this data is at your sole risk, and you agree to be bound by strict intellectual property protections prohibiting the unauthorized redistribution or modification of this work.