
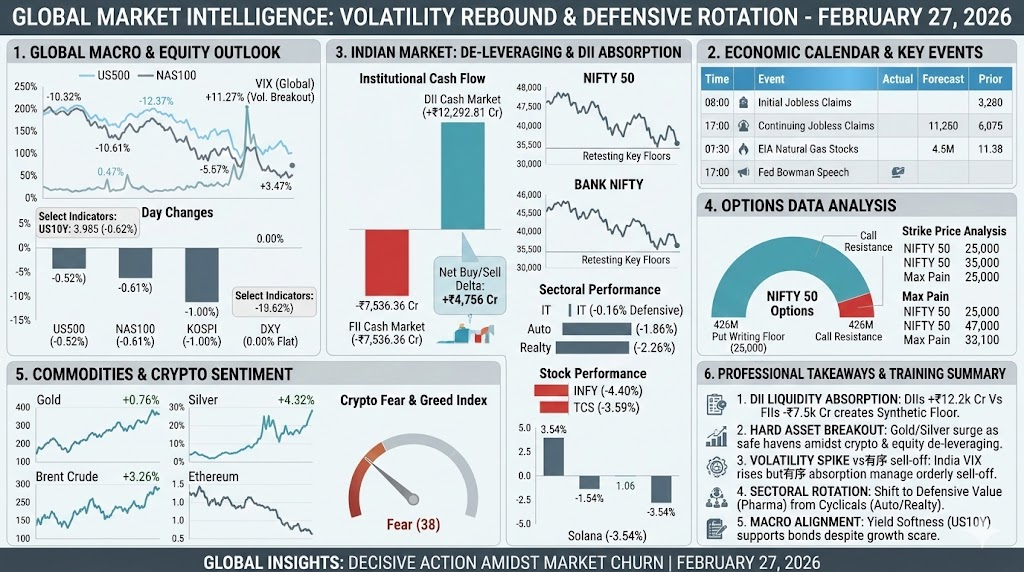
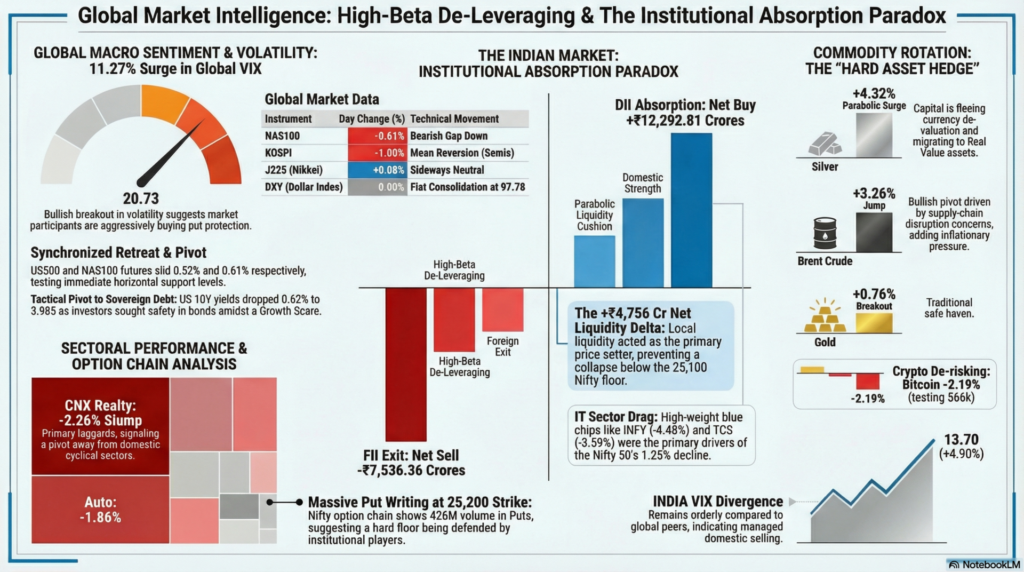
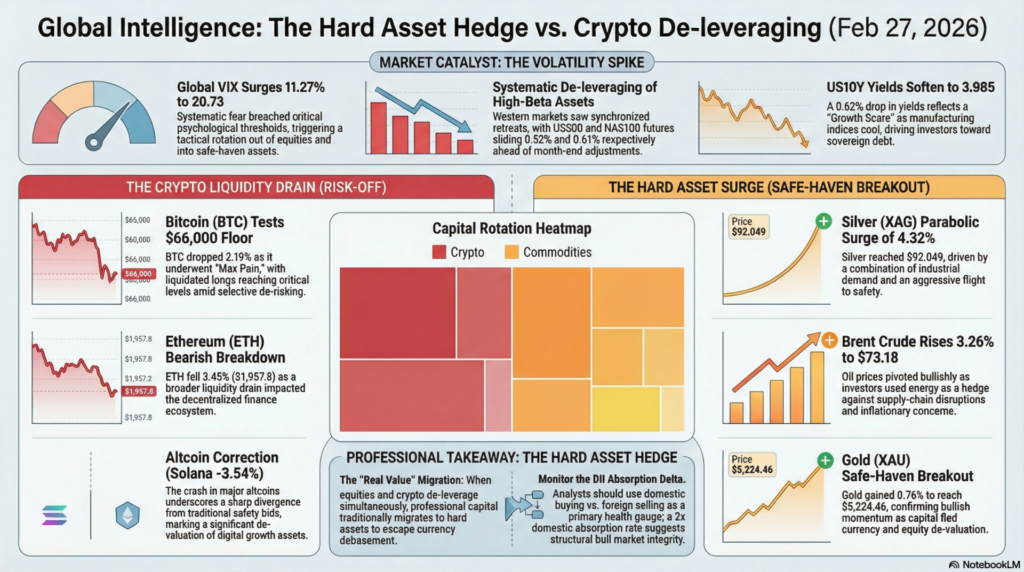
The global financial landscape on February 27, 2026, transitioned into a high-volatility regime as high-beta assets faced sharp de-leveraging across international borders. Western markets exhibited a synchronized retreat, with the US500 and NAS100 futures sliding 0.52% and 0.61% respectively, signaling a cautious stance ahead of month-end adjustments. European benchmarks like the FESX1 and FCE1 traded with a bearish bias as regional sentiment softened. The defining macro event of the session was the explosive 11.27% surge in the Global VIX to 20.73, indicating that systematic fear has breached critical psychological thresholds and capital is pivoting toward safe-haven assets.
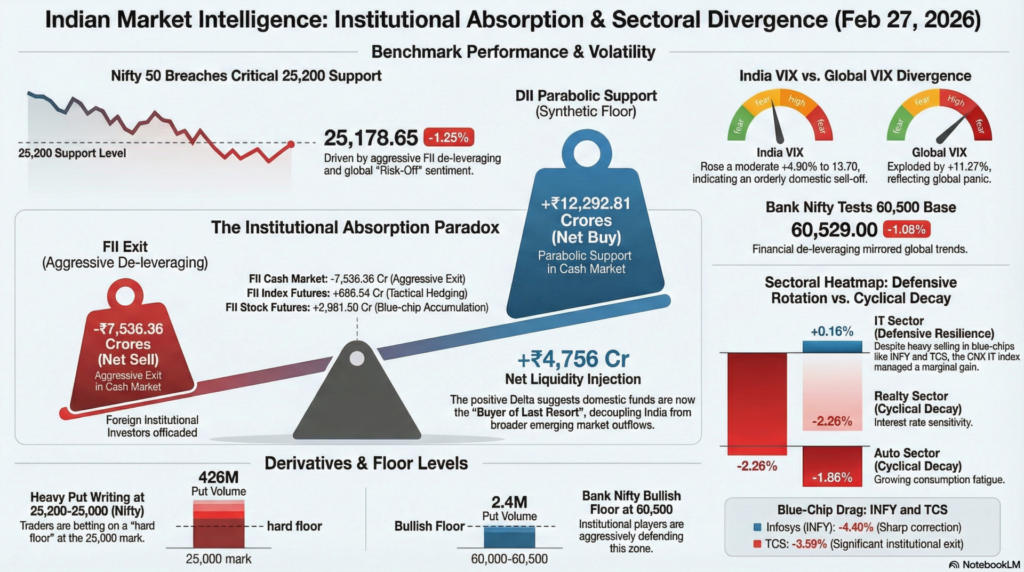
In the Indian domestic market, the narrative was dominated by an aggressive “Flight to Quality” as major benchmarks succumbed to selling pressure. The Nifty 50 and Sensex crashed 1.25% and 1.17% respectively, primarily dragged down by a sharp 4.40% correction in IT heavyweights and nearly 2% declines in the Auto and Realty sectors. Institutional activity highlighted a massive divergence; Foreign Institutional Investors (FIIs) offloaded a staggering net -₹7,536.36 Crores, marking one of the largest single-day exits in recent months. Conversely, Domestic Institutional Investors (DIIs) provided a parabolic liquidity cushion with a net buy of +₹12,292.81 Crores, effectively absorbing the foreign outflow and preventing a structural collapse of the technical floor at the 25,100 Nifty level.
| Instrument | Price / Rate | Day Change (%) | Technical Movement | Key Event / Driver |
| US500 | 6,854.7 | -0.52% | Testing 6,850 Support | Risk-Off Rotation |
| NAS100 | 24,831.3 | -0.61% | Bearish Gap Down | Tech Sector Pressure |
| J225 (Nikkei) | 58,642.8 | +0.08% | Sideways Neutral | Resilience in Yen Weakness |
| KOSPI | 6,244.13 | -1.00% | Mean Reversion | Profit Booking in Semis |
| VIX (Global) | 20.73 | +11.27% | Bullish Breakout | Volatility Spike |
| DXY | 97.782 | 0.00% | Flat Consolidation | Dollar Stability |
| US10Y | 3.985 | -0.62% | Bullish for Bonds | Yield Softness |
Technical Analysis: Global futures are currently undergoing a “Volatility Expansion” phase. The 11.27% spike in the Global VIX suggests that market participants are aggressively buying protection (Puts) as indices like the US500 test immediate horizontal support. The bearish momentum in the KOSPI (-1.00%) further confirms that the “Risk-Off” sentiment is spreading across Asian growth hubs.
Fundamental Analysis: The overarching fundamental theme is a re-rating of growth valuations amidst a stabilizing Dollar Index (DXY) at 97.78. Investors are reacting to a potential “Growth Scare” as manufacturing indices in major economies begin to show signs of cooling, leading to a tactical rotation out of equities and into sovereign debt (US10Y -0.62%).
Economic Announcements Summary: The session is marked by a heavy macro calendar, including Continuing Jobless Claims (1,860K) and Initial Jobless Claims (215K) which align with forecasts. Traders are also monitoring the EIA Natural Gas Stocks Change (-36 B cf) and a critical Fed Bowman Speech for cues on liquidity management for the upcoming quarter.
| Index / Sector | Last Price | Day Change (%) | Technical Movement | Event / Driver |
| NIFTY 50 | 25,178.65 | -1.25% | Breaching 25,200 | FII Selling Pressure |
| BANK NIFTY | 60,529.00 | -1.08% | Testing 60,500 Base | Financial De-leveraging |
| INDIA VIX | 13.70 | +4.90% | Rising Fear Floor | Hedging Demand |
| CNX IT | 30,603.85 | +0.16% | Defensive Outperformance | Global Tech Divergence |
| CNX AUTO | 28,158.85 | -1.86% | Bearish Breakdown | Consumption Fatigue |
| CNX REALTY | 780.60 | -2.26% | Sectoral Laggard | Interest Rate Sensitivity |
| INFY | 1,269.10 | -4.40% | Sharp Correction | Earnings Re-Rating |
| TCS | 2,580.10 | -3.59% | Bearish Pivot | Institutional Exit |
Technical Analysis: The Nifty 50 has formed a decisive bearish candle, breaching the 25,200 support level. While the India VIX surged 4.90% to 13.70, the absolute level remains relatively low compared to global peers, suggesting that the domestic sell-off is being orderly managed by DII absorption. Sectorally, Realty and Auto are the primary laggards, indicating a fundamental pivot away from domestic cyclical sectors.
Fundamental Analysis: Domestic sentiment is under duress as blue-chip giants like INFY (-4.40%) and TCS (-3.59%) lead the decline. However, the FII/DII Net Delta of +₹4,756 Crores (DII buy – FII sell) indicates that local liquidity is now the primary price setter for the Indian market, fundamentally decoupling it from global emerging market outflows.
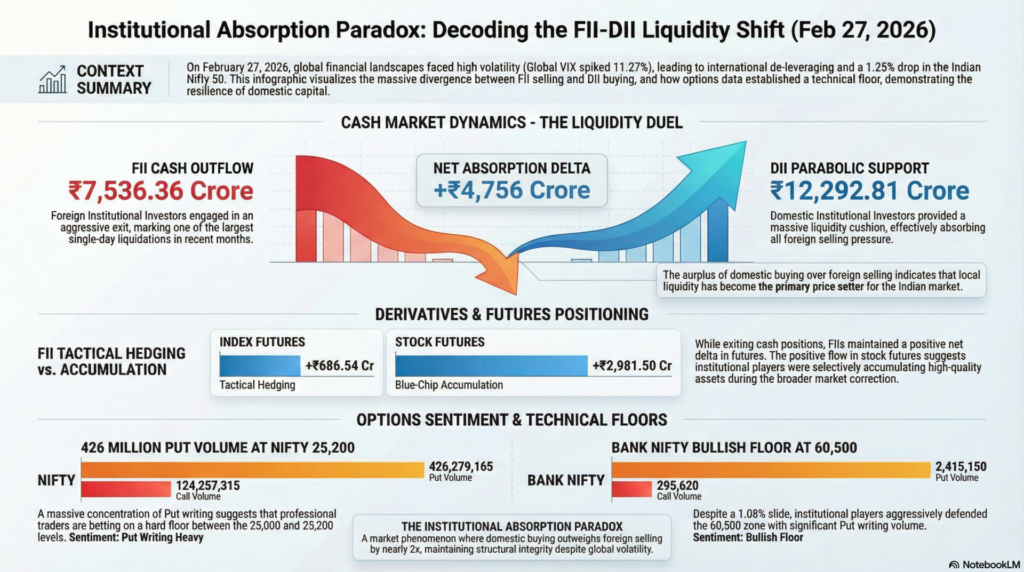
| Segment | Net Buy/Sell (Cr) | Action Bias |
| FII Cash Market | -7,536.36 | Aggressive Exit |
| DII Cash Market | +12,292.81 | Parabolic Support |
| FII Index Futures | +686.54 | Tactical Hedging |
| FII Stock Futures | +2,981.50 | Blue-chip Accumulation |
| Index | ATM Strike | Put Volume (Max) | Call Volume (Max) | Market Sentiment |
| NIFTY | 25,200 | 426,279,165 | 124,257,315 | Put Writing Heavy |
| BANK NIFTY | 60,500 | 2,415,150 | 295,620 | Bullish Floor |
Technical Analysis: The Nifty option chain exhibits a massive concentration of Put writing at the 25,200-25,000 strikes (426M volume), suggesting that traders are betting on a hard floor at 25,000. In Bank Nifty, the Max Put volume at 60,500 indicates that institutional players are aggressively defending the 60,500-60,000 zone despite the 1% slide.
Fundamental Analysis: Institutional behavior exhibits a “Transfer of Ownership”; FIIs are liquidating cash positions (-₹7.5k Cr), while DIIs are deploying record levels of capital (+₹12.2k Cr). This indicates a structural shift where domestic mutual funds and insurance companies are becoming the “Buyer of Last Resort” for the Indian economy.
| Instrument | Price | Day Change (%) | Technical Status | Headline Sentiment |
| Bitcoin (BTC) | $66,013.89 | -2.19% | Testing $66k Floor | Selective De-risking |
| Ethereum (ETH) | $1,957.8 | -3.45% | Bearish Breakdown | Liquidity Drain |
| GOLD (XAUUSD) | $5,224.46 | +0.76% | Safe Haven Breakout | Bullish Momentum |
| SILVER | $92.049 | +4.32% | Parabolic Surge | Industrial/Safety Demand |
| BRENT CRUDE | $73.185 | +3.26% | Bullish Pivot | Supply Concern Hedge |
| NATGAS | $2.929 | +1.60% | Bottoming Out | Mean Reversion |
Technical Analysis: Commodities are the star performers in a “Risk-Off” environment, led by a parabolic 4.32% surge in Silver and a 3.26% rise in Brent Crude. This technical breakout in hard assets suggests that capital is fleeing currency and equity de-valuation. In crypto, Bitcoin is undergoing “Max Pain” as it tests the $66,000 support, with liquidated longs reaching critical levels.
Fundamental Analysis: The crypto market sentiment is seeing a sharp divergence; while Solana (-3.54%) and Ethereum (-3.45%) crash, gold and silver attract fundamental safety bids. The 3.26% jump in Brent Crude reflects growing fundamental concerns regarding supply-chain disruptions, adding an inflationary layer to the global macro outlook.
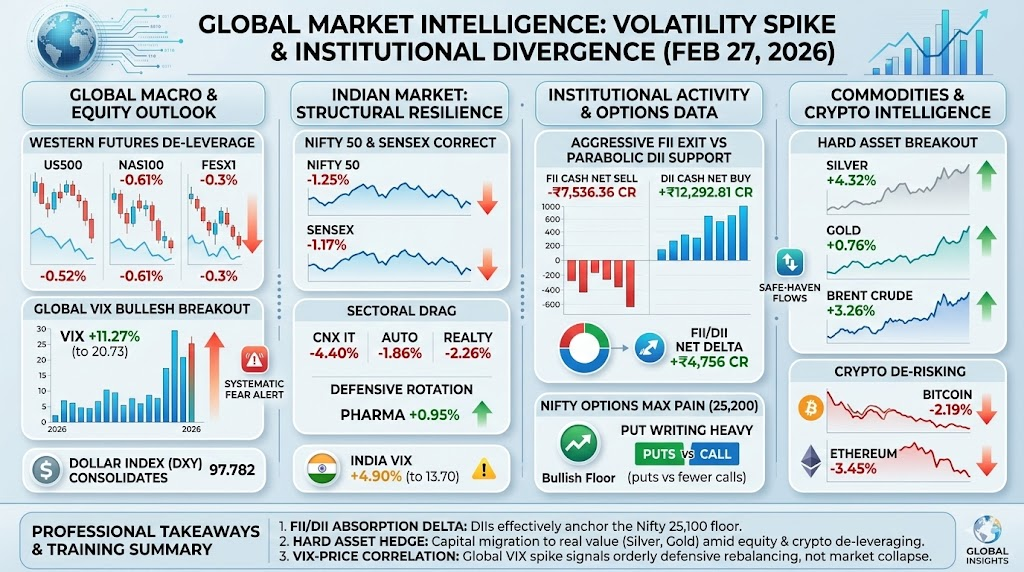
For educational and training purposes, today’s session highlights the “Institutional Absorption Paradox.” When FIIs sell ₹7,536 Cr but DIIs buy ₹12,292 Cr, the net liquidity injection of +₹4,756 Cr creates a “Synthetic Floor”. For a trainee trader, the key lesson is the VIX-Price Correlation; the Global VIX surged 11.27% while the Nifty fell only 1.25%, proving that professional investors were pricing in a much larger crash than what actually transpired, leading to potential “Short Squeeze” opportunities in the coming sessions.
Secondly, the “Hard Asset Hedge” (Silver +4.32%, Brent +3.26%) serves as a definitive professional signal of capital rotation. When equities and crypto de-leverage simultaneously, money traditionally migrates to “Real Value” to escape currency debasement. For a professional analyst, the takeaway is absolute: use the “DII Absorption Delta” as your primary health gauge; as long as domestic buying outweighs foreign selling by nearly 2x, the structural bull market in India remains technically intact despite the “noise” of global volatility.
Legal Disclaimer & Liability Waiver
This AI-generated report is strictly educational and does not constitute financial, legal, or professional advice. aiTrendview and its affiliates are not SEBI-registered advisors and assume zero liability for any losses or consequences resulting from its use. All data is autonomously harvested from public sources and may be flawed, delayed, or incomplete; therefore, you assume exclusive responsibility for independently verifying information before taking any action. Under no circumstances should this content be construed as a recommendation to trade or speculate in any security. By accessing this material, you acknowledge that any reliance on this data is at your sole risk, and you agree to be bound by strict intellectual property protections prohibiting the unauthorized redistribution or modification of this work.