
Bullish Resurgence and Tactical Rebalancing Amid Institutional Pivot
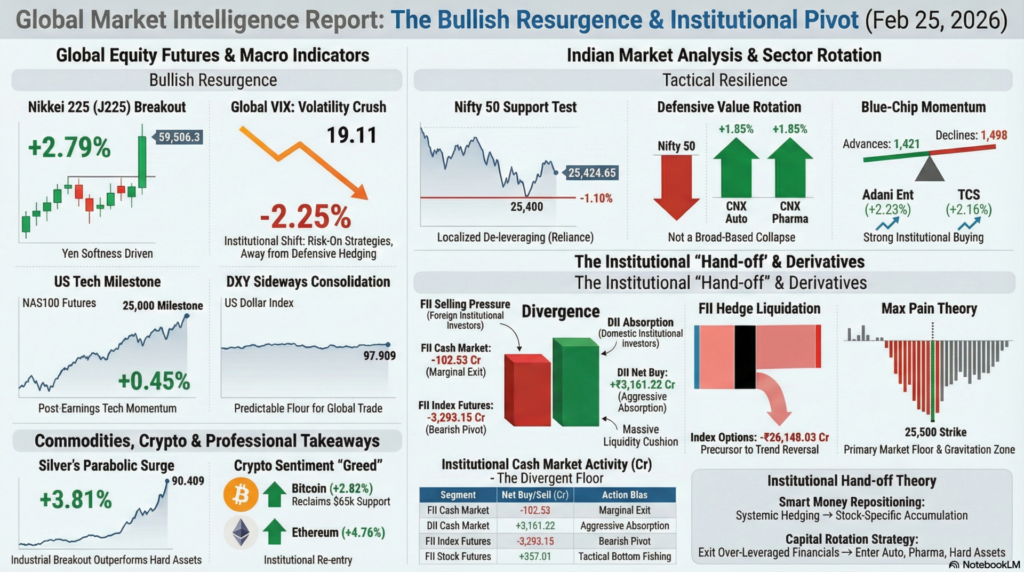
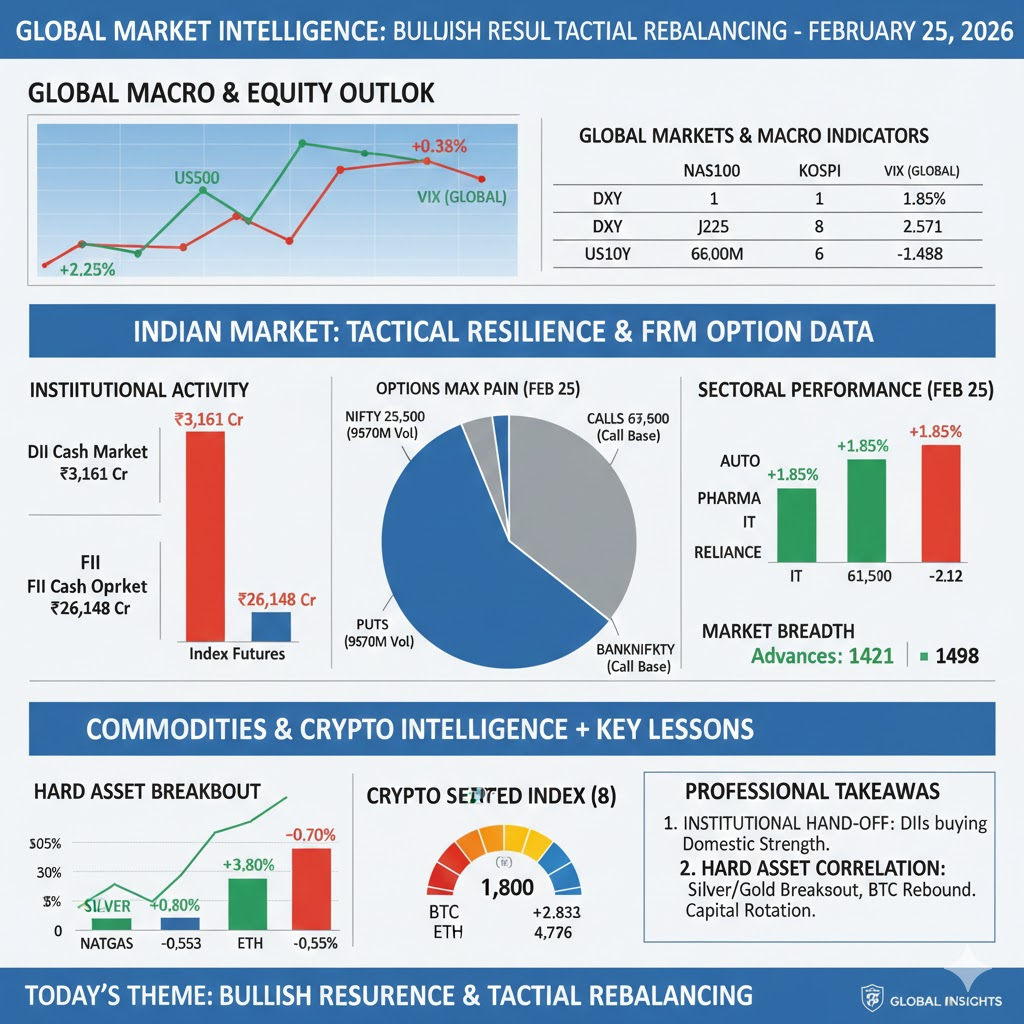
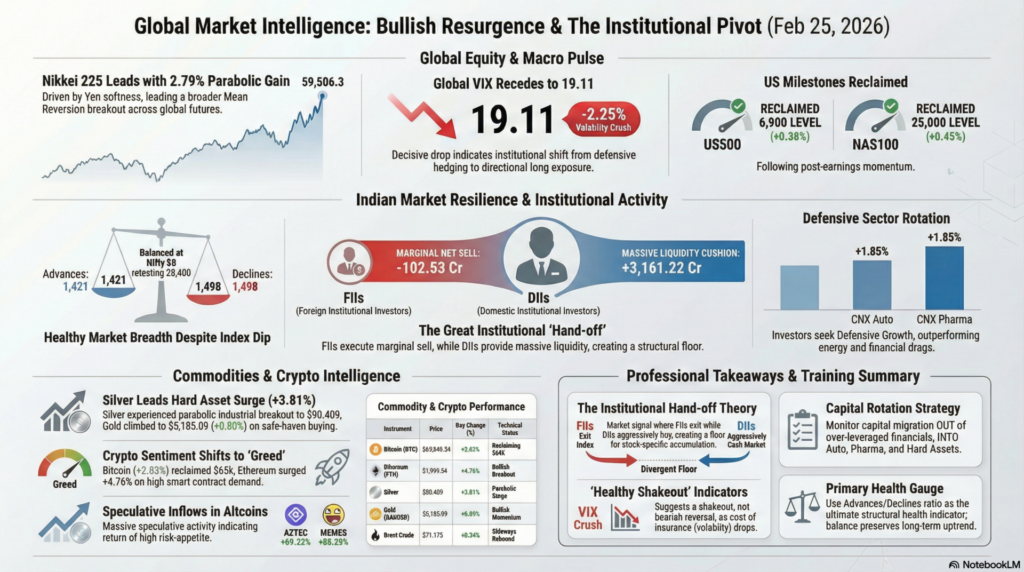
The global financial landscape on February 25, 2026, is characterized by a “Bullish Resurgence” as major equity indices across the globe reclaim psychological milestones. Western markets are leading this charge, with the US500 and NAS100 futures gaining 0.38% and 0.45% respectively, signaling a renewed appetite for risk following recent consolidation. This optimism is bolstered by a decisive 2.25% crash in the Global VIX, which has retreated to the 19.11 level, indicating that systematic fear is receding in favor of structural accumulation. European benchmarks, specifically the FESX1 and FDAX1, are also trading with a positive bias, suggesting a synchronized global stabilization as the Dollar Index (DXY) finds a steady floor near 97.90.
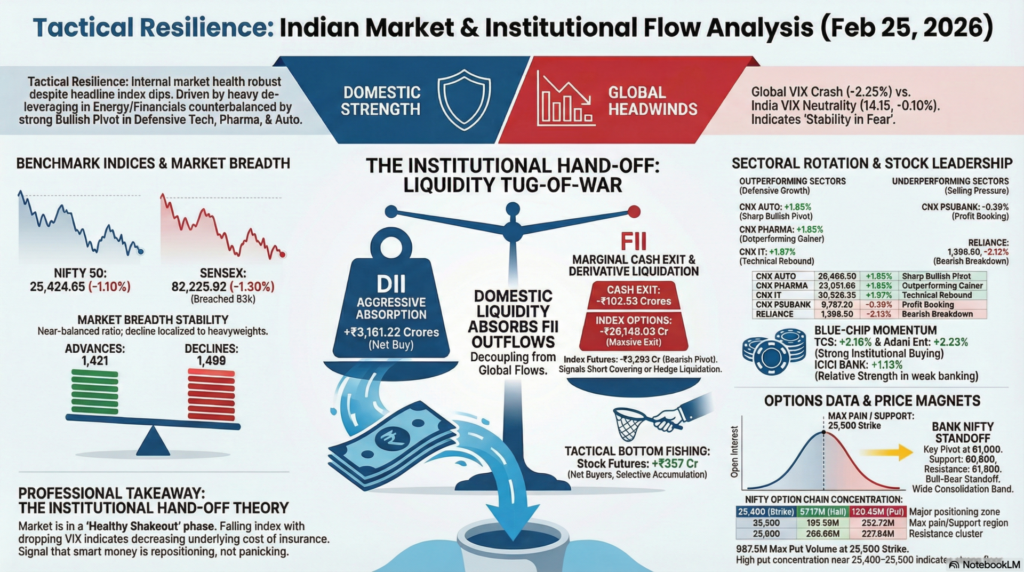
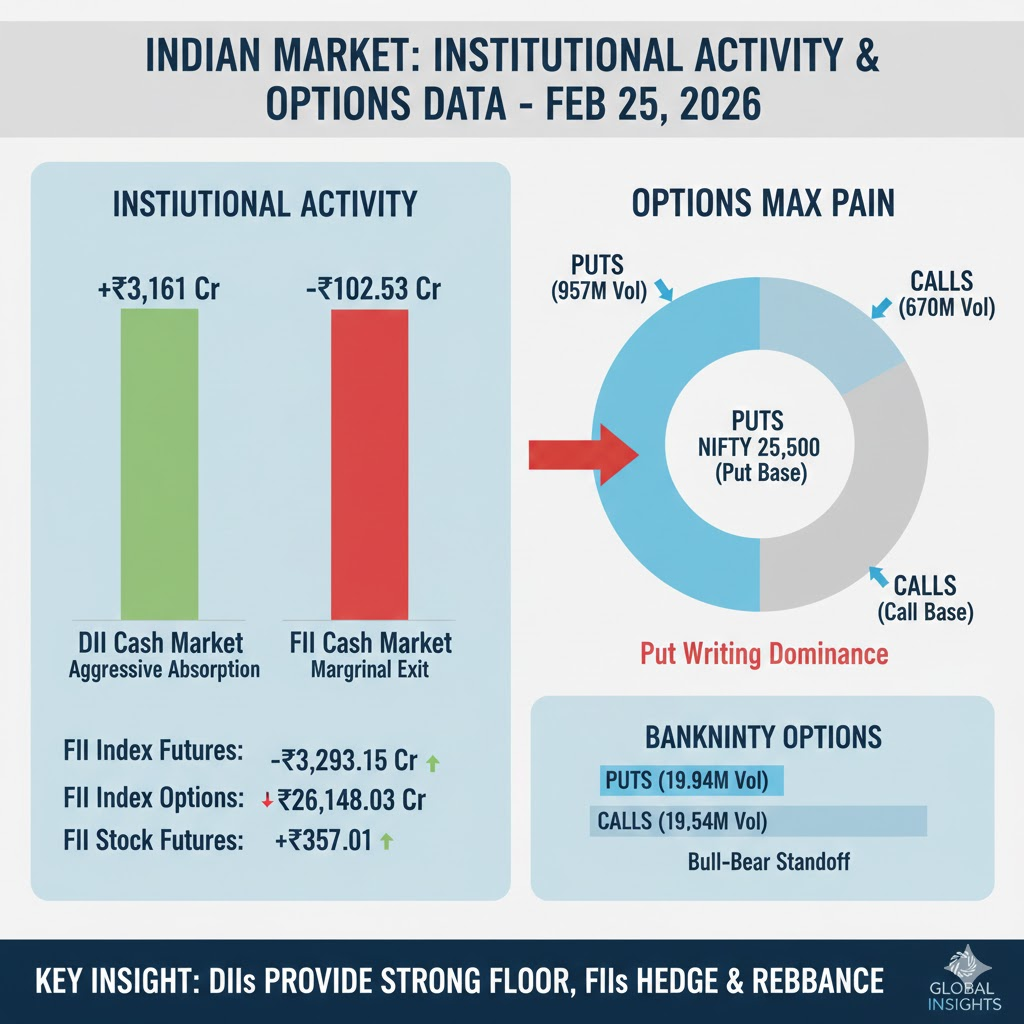
In the Indian domestic market, the narrative is one of “Tactical Resilience” despite a marginal dip in the primary benchmarks. The Nifty 50 recorded a loss of roughly 1.1% to close at 25,424.65, largely driven by heavy de-leveraging in the IT and Financial sectors. However, institutional activity tells a deeper story of underlying strength; while Foreign Institutional Investors (FIIs) executed a marginal net sell of -₹102.53 Crores, Domestic Institutional Investors (DIIs) provided a massive liquidity cushion with a net buy of +₹3,161.22 Crores. This institutional “hand-off” suggests that domestic capital is aggressively absorbing global selling pressure, specifically in PSU Banks and Energy sectors, which continue to outperform the broader market drag.
| Instrument | Price / Rate | Day Change (%) | Technical Movement | Key Event / Driver |
| US500 | 6,912.2 | +0.38% | Breaking 6,900 Pivot | Post-Earnings Momentum |
| NAS100 | 25,080.1 | +0.45% | Reclaiming 25k Milestone | Tech Rebound |
| US30 | 49,321.00 | +0.36% | Testing 49,500 Resistance | Industrial Resilience |
| J225 (Nikkei) | 59,506.3 | +2.79% | Bullish Breakout | Yen Softness Impact |
| KOSPI | 6,083.86 | +1.91% | Strong Momentum | Semi-conductor Strength |
| VIX (Global) | 19.11 | -2.25% | Volatility Crush | Receding Market Fear |
| DXY | 97.909 | +0.03% | Sideways Consolidation | Stable Dollar Floor |
Technical Analysis: Global futures are exhibiting a “Mean Reversion” breakout, with the Nikkei 225 leading the charge with a parabolic 2.79% gain. The breakdown of the Global VIX by 2.25% is a primary technical trigger, indicating that institutional players are shifting from defensive hedging to directional long exposure across developed markets.
Fundamental Analysis: The overarching fundamental theme is the stabilization of interest rate expectations. With US10Y yields at 4.056% (+0.47%), the market is pricing in a “higher-for-longer” scenario that is surprisingly being absorbed by equities without significant valuation compression.
Economic Announcements: The session is front-loaded with critical Federal Reserve guidance, including the Fed Barkin and Fed Musalem Speeches. Additionally, the EIA Crude Oil Stocks Change (Forecast: 1.8M vs Prior: -9.014M) will provide a definitive direction for energy-sensitive equities.
| Index / Sector | Last Price | Day Change (%) | Technical Movement | Event / Driver |
| NIFTY 50 | 25,424.65 | -1.10% | Retesting 25,400 Support | Sectoral De-leveraging |
| SENSEX | 82,225.92 | -1.30% | Breaching 83k Pivot | Large-cap Drag |
| INDIA VIX | 14.15 | -0.10% | Sideways Neutral | Stability in Fear |
| CNX IT | 30,526.35 | +1.57% | Technical Rebound | Defensive Tech Buying |
| CNX PSUBANK | 9,787.20 | -0.39% | Profit Booking | Credit Growth Jitters |
| CNX AUTO | 28,466.50 | +1.85% | Sharp Bullish Pivot | Sales Volume Rebound |
| CNX PHARMA | 23,051.85 | +1.85% | Outperforming Gainer | Defensive Value Rotation |
| RELIANCE | 1,398.50 | -2.12% | Bearish Breakdown | Energy Price Volatility |
Banking Stocks
| Bank | Change | % | Technical Movement & Event |
|---|---|---|---|
| HDFC Bank | −2.90 | −0.32% | Consolidation after decline |
| Kotak Bank | −2.75 | −0.64% | Weak momentum |
| ICICI Bank | +15.70 | +1.13% | Relative strength leader |
| SBI | −23.20 | −1.90% | Profit-taking |
| Axis Bank | +15.40 | +1.11% | Recovery attempt |
| Stock | Change | % | Technical Movement & Event |
|---|---|---|---|
| Reliance | −30.30 | −2.12% | Energy weakness weighing |
| Infosys | +14.60 | +1.14% | IT sector tailwind |
| TCS | +55.60 | +2.16% | Strong institutional buying |
| Adani Ent | +48.70 | +2.23% | Momentum breakout |
| UltraTech | +81.00 | +0.63% | Infrastructure demand |
Technical Analysis: Despite the 1.1% dip in the Nifty 50, the internal market breadth remains surprisingly healthy with the Auto and Pharma sectors gaining 1.85% each. A major technical event is the 1,421 Advances vs 1,498 Declines, suggesting that the index fall is localized to heavyweights like Reliance (-2.12%) rather than a broad-based market collapse.
Fundamental Analysis: Domestic sentiment is propped up by the Market Capitalization standing at $5.12 Trillion (₹465.29 Lac Crs). The outperformance of Pharma and Tech suggests a fundamental rotation into “Defensive Growth” as investors seek shelter from the volatility in the energy and financial segments.
| Segment | Net Buy/Sell (Cr) | Action Bias |
| FII Cash Market | -102.53 | Marginal Exit |
| DII Cash Market | +3,161.22 | Aggressive Absorption |
| FII Index Futures | -3,293.15 | Bearish Pivot |
| FII Index Options | -26,148.03 | Massive Hedge Exit |
| FII Stock Futures | +357.01 | Tactical Bottom Fishing |
| Index | ATM Strike | Put Volume (Max) | Call Volume (Max) | Market Sentiment |
| NIFTY | 25,450 | 987,542,010 | 670,887,295 | Put Writing Dominance |
| BANKNIFTY | 61,000 | 19,940,010 | 19,548,840 | Bull-Bear Standoff |
Options Data — NIFTY
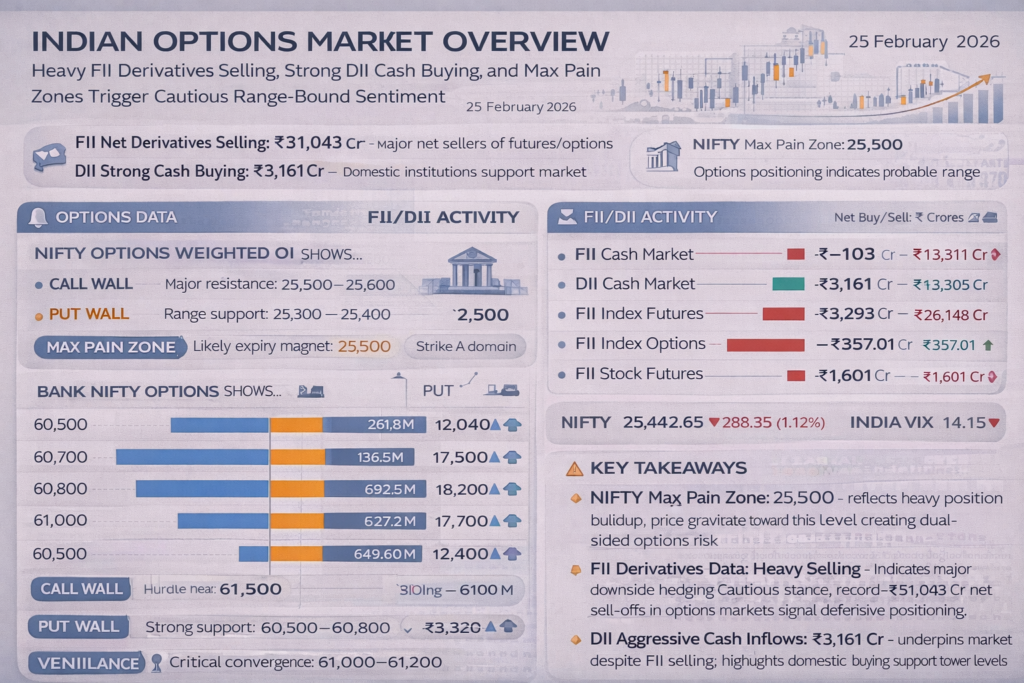
| Strike | Call Volume | Put Volume | Interpretation |
|---|---|---|---|
| 25,200 | 3.21M | 83.20M | Strong resistance |
| 25,300 | 13.78M | 110.07M | Heavy put activity |
| 25,400 | 57.17M | 180.46M | Major positioning zone |
| 25,500 | 195.58M | 282.72M | Max pain region |
| 25,600 | 266.66M | 227.94M | Resistance cluster |
| 25,700 | 192.03M | 76.14M | Upside call writing |
Technical Movement & Event
High put volumes near 25,400–25,500 indicate strong support, while heavy call activity above suggests resistance. This creates a probable trading range. Max pain theory suggests price gravitation toward the 25,500 zone. Elevated activity signals heightened volatility expectations. Institutional traders appear to be positioning for sideways movement.
| Strike | Call Volume | Put Volume | Interpretation |
|---|---|---|---|
| 60,500 | 149K | 1.27M | Downside protection |
| 60,800 | 329K | 1.12M | Support region |
| 61,000 | — | — | Key pivot level |
| 61,200 | — | 2.41M | Strong put buildup |
| 61,500 | 2.26M | — | Resistance |
Technical Movement & Event
Bank Nifty shows significant put writing below current levels, suggesting strong downside support. However, call buildup above indicates limited upside. The index may trade in a wide consolidation band. Weak banking stocks reinforce this view. Volatility spikes could occur near expiry.
Technical Analysis: The Nifty option chain exhibits a massive concentration of Put writing at the 25,500 strike (987M volume), suggesting that domestic traders view this as a primary floor. Conversely, the -₹26,148 Cr FII Index Option exit indicates a massive “Short Covering” or a “Hedge Liquidation” event, often a precursor to a sharp trend reversal.
Fundamental Analysis: Institutional behavior exhibits a strong “Domestic Takeover”; with DIIs buying +₹3,161 Cr, the Indian market is becoming increasingly decoupled from FII flows. This structural shift suggests that the “India Growth Story” is being internally funded by robust SIP and domestic pension fund inflows.
| Instrument | Price | Day Change (%) | Technical Status | Headline Sentiment |
| Bitcoin (BTC) | $65,848.54 | +2.83% | Reclaiming $65k Support | Institutional Re-entry |
| Ethereum (ETH) | $1,939.54 | +4.76% | Bullish Breakout | Smart Contract Demand |
| GOLD (XAUUSD) | $5,185.09 | +0.80% | Bullish Momentum | Safe Haven Buying |
| SILVER | $90.409 | +3.81% | Parabolic Surge | Industrial Breakout |
| BRENT CRUDE | $71.175 | +0.34% | Sideways Rebound | Supply Risk Hedge |
| NATGAS | $2.919 | -0.55% | Bearish Breakdown | Oversupply Drag |
Technical Analysis: Commodities are leading the “Risk-On” charge today, with Silver surging 3.81% and Gold hitting $5,185. In the crypto market, Bitcoin is undergoing a period of “Max Pain” near $68,333, with short distances reaching +0.98%, suggesting that a short-squeeze is imminent if the $67k resistance is breached.
Fundamental Analysis: The crypto market sentiment is shifting back to “Greed” as AZTEC (+89.22%) and MEMES (+55.25%) see massive speculative inflows. The fundamental floor for Brent crude is being maintained by steady EIA Crude Oil Stocks expectations, despite the marginal 0.34% price gain.
For training and educational purposes, today’s session highlights the “Institutional Hand-off Theory.” When FIIs exit Index Futures (-₹3,293 Cr) and Options (-₹26,148 Cr) but DIIs aggressively buy Cash Market (+₹3,161 Cr), it creates a “Divergent Floor”. For a trainee trader, this is a signal that the market’s “Smart Money” is repositioning from systemic hedging into stock-specific accumulation. This is further validated by the VIX Crush (-2.25%), which suggests that while the index price is falling, the underlying volatility (cost of insurance) is also dropping—a classic sign of a “Healthy Shakeout” rather than a bearish reversal.
Secondly, the “Hard Asset Correlation” (Silver +3.81%, Gold +0.80%) occurring alongside a crypto rebound (BTC +2.83%) indicates a broad-based liquidity infusion into alternative assets. For a professional analyst, the takeaway is clear: the market is currently in a “Capital Rotation” phase. Money is moving out of over-leveraged large-cap financials and into Auto, Pharma, and Hard Assets. Trainees should use the “Advances vs Declines” ratio (1,421 vs 1,498) as their primary health gauge; as long as this remains balanced despite an index fall, the structural uptrend of the market remains intact.
Legal Disclaimer & Liability Waiver
This AI-generated report is strictly educational and does not constitute financial, legal, or professional advice. aiTrendview and its affiliates are not SEBI-registered advisors and assume zero liability for any losses or consequences resulting from its use. All data is autonomously harvested from public sources and may be flawed, delayed, or incomplete; therefore, you assume exclusive responsibility for independently verifying information before taking any action. Under no circumstances should this content be construed as a recommendation to trade or speculate in any security. By accessing this material, you acknowledge that any reliance on this data is at your sole risk, and you agree to be bound by strict intellectual property protections prohibiting the unauthorized redistribution or modification of this work.