


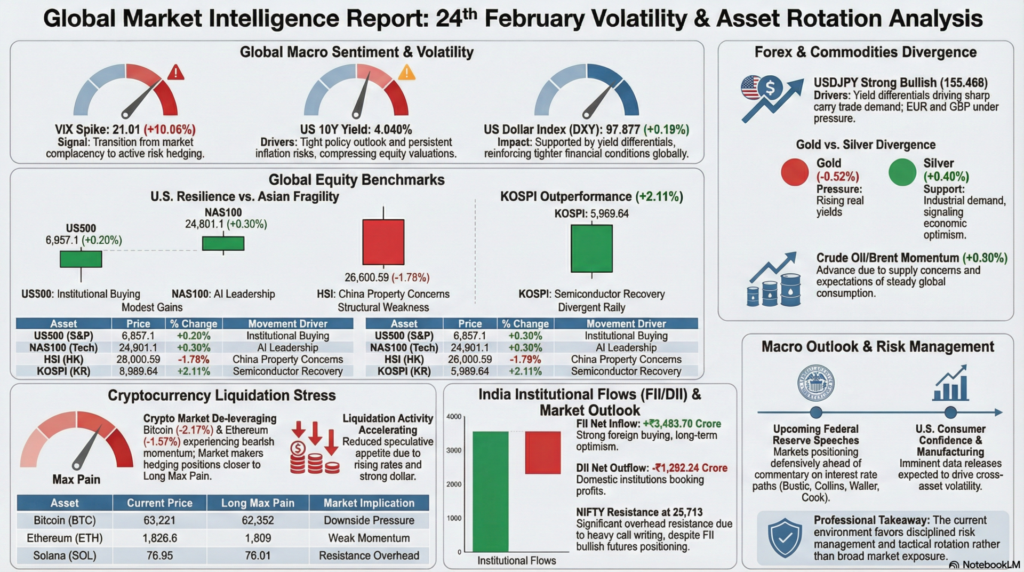
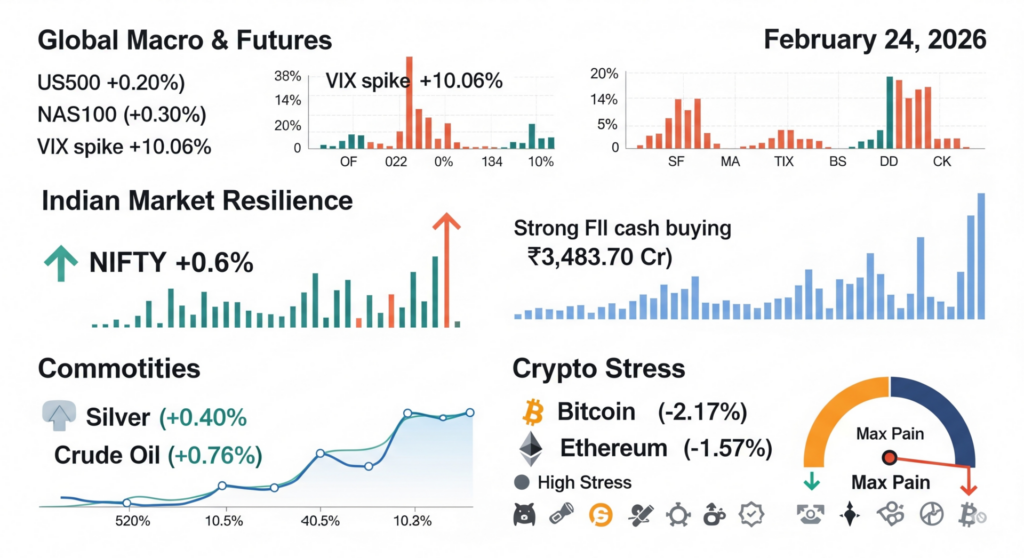
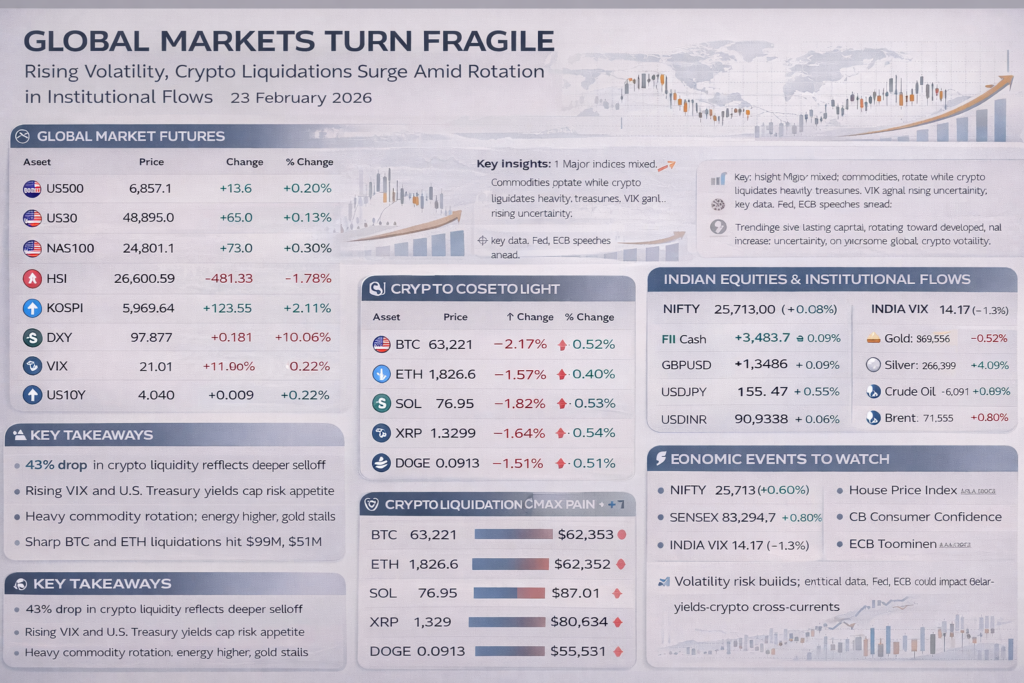
Global financial markets are entering a more fragile phase as volatility indicators climb and cross-asset performance diverges sharply. U.S. equity futures remain resilient with modest gains in the S&P 500, Dow Jones, and Nasdaq contracts, signaling continued institutional participation in developed markets. However, Asian benchmarks show notable weakness, particularly in Hong Kong, indicating regional risk aversion. Rising U.S. Treasury yields and a firm dollar reinforce tighter financial conditions. Simultaneously, the VIX spike suggests that hedging demand is returning after a period of complacency.
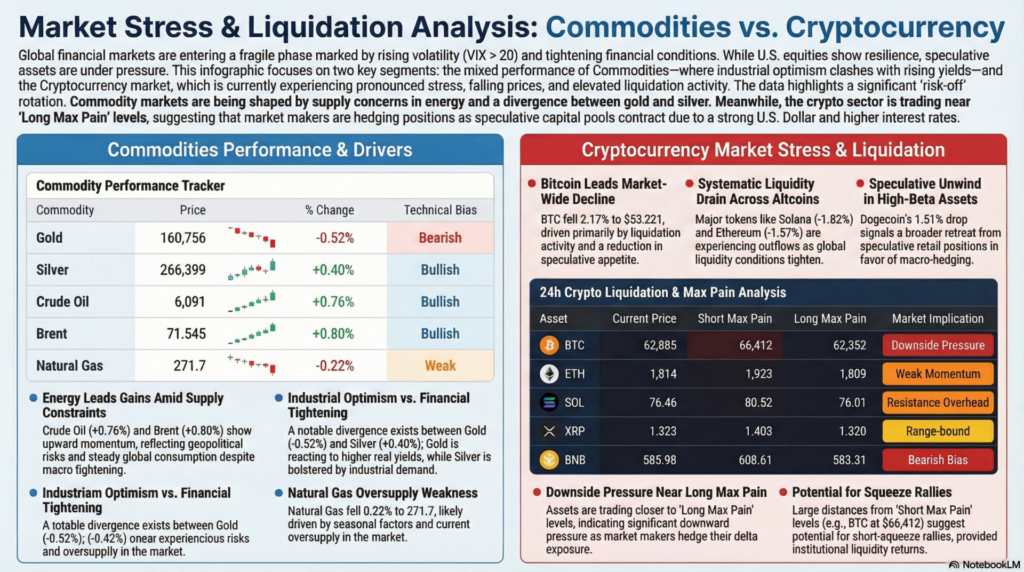
Commodity markets present a mixed but informative picture. Energy prices are advancing, pointing to firm global demand expectations or supply constraints, while precious metals show diverging trends between gold and silver. In foreign exchange markets, the dollar’s strength against the yen contrasts with mild weakness against European currencies, reflecting uneven global monetary expectations. Emerging market currencies such as the Indian rupee remain under pressure. Together, these signals indicate a selective risk-on environment dominated by macro positioning rather than broad optimism.
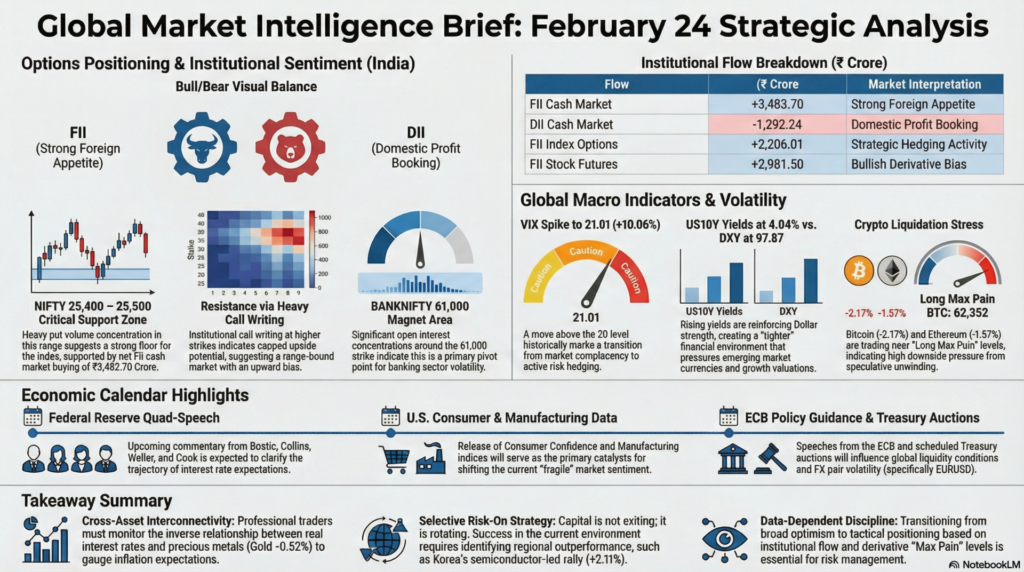
Crypto markets, meanwhile, are experiencing pronounced stress characterized by falling prices across major tokens and elevated liquidation activity. The contraction in liquidity and persistent negative price momentum highlight risk-off behavior among speculative capital pools. Institutional flows in India appear supportive on the surface, with strong foreign buying in equities, yet sectoral breadth remains weak, particularly in technology and financials. Upcoming central bank speeches and economic data releases add uncertainty, increasing the likelihood of volatility spikes.
| Asset | Price | Change | % Change | Technical Movement | Key Event/Driver |
|---|---|---|---|---|---|
| US500 | 6,857.1 | +13.6 | +0.20% | Mild bullish | Institutional buying |
| US30 | 48,895.0 | +65.0 | +0.13% | Bullish bias | Cyclical strength |
| NAS100 | 24,801.1 | +73.0 | +0.30% | Tech resilience | AI leadership |
| HSI | 26,600.59 | -481.33 | -1.78% | Bearish | China concerns |
| KOSPI | 5,969.64 | +123.55 | +2.11% | Strong bullish | Semiconductor rally |
| DXY | 97.877 | +0.181 | +0.19% | Dollar strength | Yield support |
| VIX | 21.01 | +1.92 | +10.06% | Rising volatility | Risk hedging |
| US10Y | 4.040 | +0.009 | +0.22% | Higher yields | Tight policy outlook |
Technical Analysis:
U.S. indices maintain upward momentum but lack breakout conviction, suggesting consolidation within a broader uptrend. The VIX move above 20 is significant, historically marking transitions from complacency to caution. Asian divergence indicates capital rotating toward developed markets. Rising yields typically compress equity valuations, particularly growth sectors.
Fundamental Analysis:
Stronger U.S. economic expectations and persistent inflation risks support higher bond yields and a firmer dollar. Weakness in Hong Kong reflects structural issues in China’s property sector and slower growth outlook. Korea’s outperformance is linked to semiconductor demand recovery.
Economic Announcements Summary:
Multiple Federal Reserve speeches, consumer confidence data, and manufacturing surveys scheduled later in the day increase uncertainty. Treasury auctions also influence liquidity conditions. Markets are positioning defensively ahead of these events.
| Pair | Price | Change | % Change | Movement | Driver |
|---|---|---|---|---|---|
| EURUSD | 1.1775 | -0.00097 | -0.08% | Slight bearish | Dollar strength |
| GBPUSD | 1.3480 | -0.00111 | -0.08% | Weakness | Policy divergence |
| USDJPY | 155.466 | +0.822 | +0.53% | Strong bullish | Yield differential |
| USDINR | 90.938 | -0.053 | -0.06% | Mild INR strength | Local flows |
Technical Analysis:
USDJPY’s sharp rise indicates strong carry trade demand as U.S. yields outpace Japanese rates. EURUSD and GBPUSD remain under pressure, suggesting continued dollar dominance. Emerging market currencies are stable but vulnerable to capital outflows.
Fundamental Analysis:
Monetary policy divergence remains the dominant theme. The Bank of Japan’s accommodative stance contrasts with tighter U.S. conditions. European growth uncertainty limits euro upside.
Economic Announcements Summary:
Central bank speeches from both the Federal Reserve and ECB will influence currency volatility. Any policy guidance could trigger rapid repricing in FX markets.
| Commodity | Price | Change | % Change | Movement | Driver |
|---|---|---|---|---|---|
| Gold | 160,756 | -842 | -0.52% | Bearish | Rising yields |
| Silver | 266,399 | +1,066 | +0.40% | Bullish | Industrial demand |
| Crude Oil | 6,091 | +46 | +0.76% | Bullish | Supply concerns |
| Brent | 71.545 | +0.570 | +0.80% | Bullish | Demand recovery |
| Natural Gas | 271.7 | -0.6 | -0.22% | Weak | Oversupply |
Technical Analysis:
Oil’s upward momentum suggests tightening supply conditions, while gold’s decline aligns with higher real yields. Divergence between gold and silver often signals industrial optimism despite financial tightening.
Fundamental Analysis:
Energy strength reflects geopolitical risks and steady consumption. Precious metals react inversely to interest rates. Natural gas weakness may be seasonal.
Economic Announcements Summary:
Energy markets remain sensitive to inventory data and geopolitical developments, while precious metals respond to inflation expectations and real interest rates.
| Asset | Price | Change | % Change | Movement | Driver |
|---|---|---|---|---|---|
| Bitcoin | 63,221 | -1,404 | -2.17% | Bearish | Liquidations |
| Ethereum | 1,826.6 | -29.1 | -1.57% | Bearish | Risk-off flows |
| Solana | 76.95 | -1.43 | -1.82% | Weak | Liquidity drain |
| XRP | 1.3296 | -0.0222 | -1.64% | Bearish | Market stress |
| Dogecoin | 0.0913 | -0.0014 | -1.51% | Weak | Speculative unwind |
| Asset | Price | Short Max Pain | Long Max Pain | Market Implication |
|---|---|---|---|---|
| BTC | 62,885 | 66,412 | 62,352 | Downside pressure |
| ETH | 1,814 | 1,923 | 1,809 | Weak momentum |
| SOL | 76.46 | 80.52 | 76.01 | Resistance overhead |
| XRP | 1.323 | 1.403 | 1.320 | Range-bound |
| BNB | 585.98 | 608.61 | 583.31 | Bearish bias |
Technical Analysis:
Prices trading closer to long max pain levels indicate downward pressure as market makers hedge positions. High short-side distances suggest potential for squeeze rallies but only if liquidity returns.
Fundamental Analysis:
Crypto markets are highly sensitive to global liquidity conditions. Rising interest rates and strong dollar reduce speculative appetite. Institutional adoption remains intact but near-term flows are cautious.
Economic Announcements Summary:
Macro data affecting risk appetite, particularly inflation and rate expectations, will strongly influence crypto volatility.
| Segment | Net Flow (₹ Crore) | Interpretation |
|---|---|---|
| FII Cash Market | +3,483.70 | Strong foreign buying |
| DII Cash Market | -1,292.24 | Domestic selling |
| FII Index Options | +2,206.01 | Hedging activity |
| FII Stock Futures | +2,981.50 | Bullish positioning |
NIFTY: 25,713 (+0.6%)
SENSEX: 83,294.66 (+0.6%)
INDIA VIX: 14.17 (-1.3%)
Technical Analysis:
Indian benchmarks remain in an uptrend supported by foreign inflows. Falling volatility suggests confidence but can precede sharp moves. Sectoral weakness in IT indicates rotation rather than broad rally.
Fundamental Analysis:
Foreign investors appear optimistic about India’s growth outlook relative to global peers. Domestic institutions may be booking profits after strong performance.
Economic Announcements Summary:
Local markets are influenced more by global cues and currency stability than domestic data in the short term.
Large open interest concentrations around near-term strikes indicate significant positioning by institutional traders.
Key Observations
Technical Analysis:
Options data implies a range-bound market with upward bias unless major macro shocks occur.
Fundamental Analysis:
Derivative positioning reflects hedging rather than outright directional bets.
Economic Announcements Summary:
Upcoming global data releases could trigger breakouts from current ranges.
Key upcoming events include:
These events collectively have the potential to shift rate expectations and drive cross-asset volatility.
Global markets are transitioning from a broad risk-on phase to a selective and data-dependent environment. Rising volatility, stronger dollar, and tightening liquidity conditions are key signals that investors are reassessing risk. Divergence across regions and asset classes suggests capital is rotating rather than exiting markets entirely. Understanding cross-asset relationships — especially between bonds, equities, and currencies — is crucial for interpreting market direction.
From a professional trading perspective, monitoring institutional flows, derivatives positioning, and macro catalysts provides a significant edge. Markets often move ahead of headlines as large players adjust exposure. The current environment favors disciplined risk management, tactical positioning, and responsiveness to economic data. For learners, this scenario illustrates how interconnected global markets are and why macro awareness is essential for advanced trading decisions.
Legal Disclaimer & Liability Waiver
This AI-generated report is strictly educational and does not constitute financial, legal, or professional advice. aiTrendview and its affiliates are not SEBI-registered advisors and assume zero liability for any losses or consequences resulting from its use. All data is autonomously harvested from public sources and may be flawed, delayed, or incomplete; therefore, you assume exclusive responsibility for independently verifying information before taking any action. Under no circumstances should this content be construed as a recommendation to trade or speculate in any security. By accessing this material, you acknowledge that any reliance on this data is at your sole risk, and you agree to be bound by strict intellectual property protections prohibiting the unauthorized redistribution or modification of this work.