


Daily Institutional Market Report — 21 February 2026
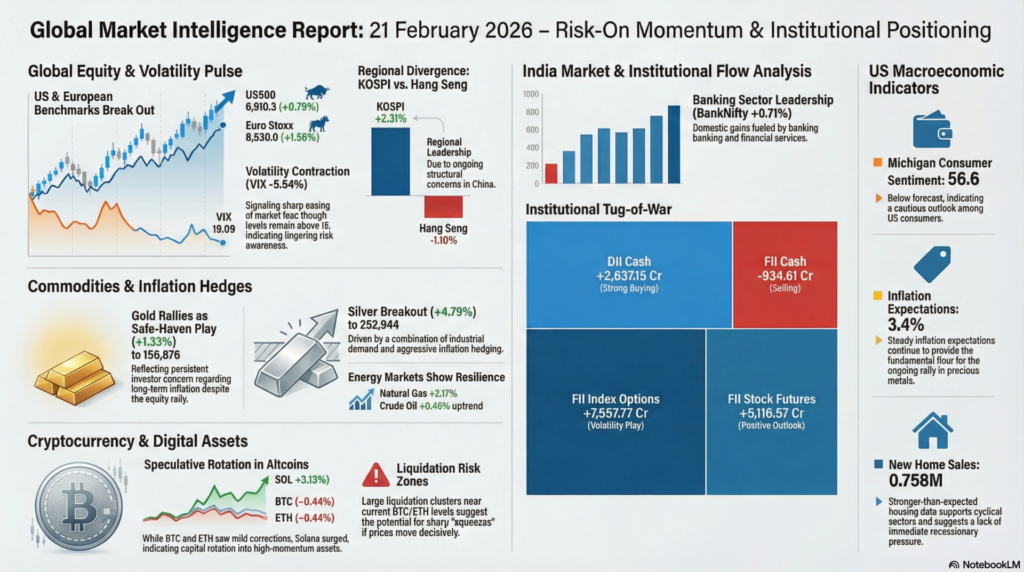
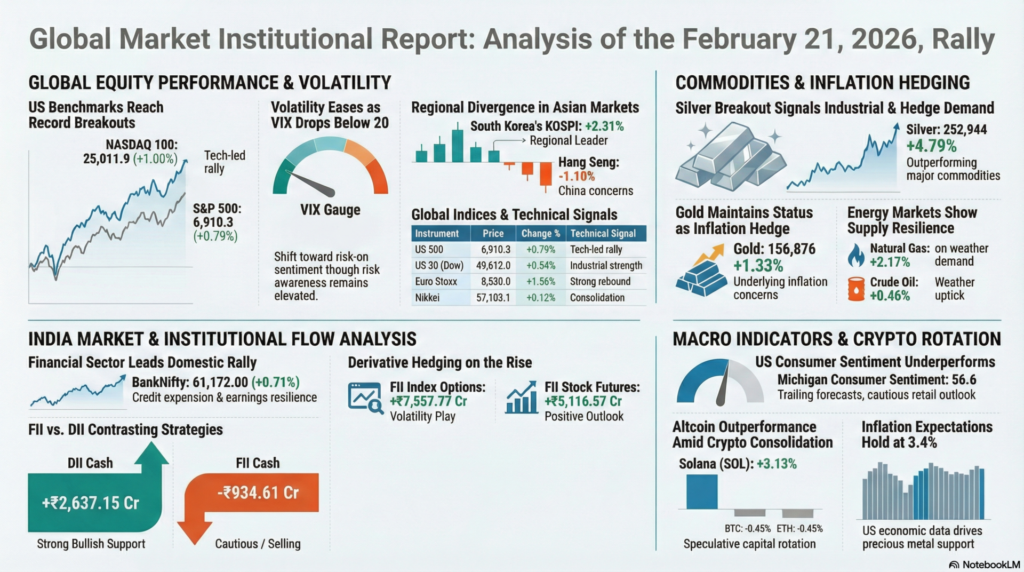
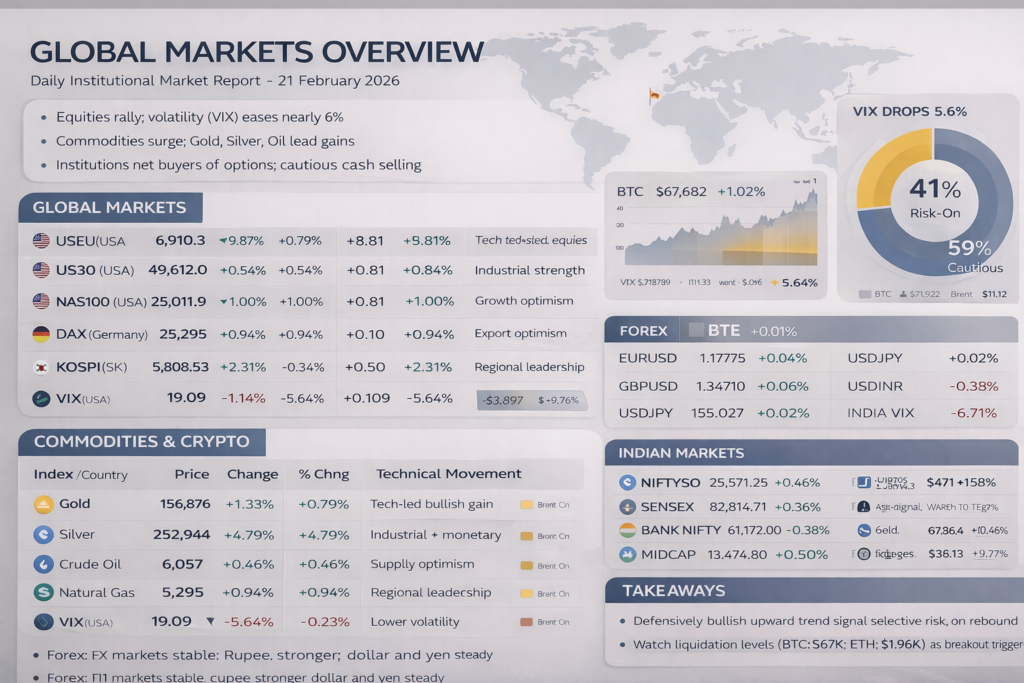
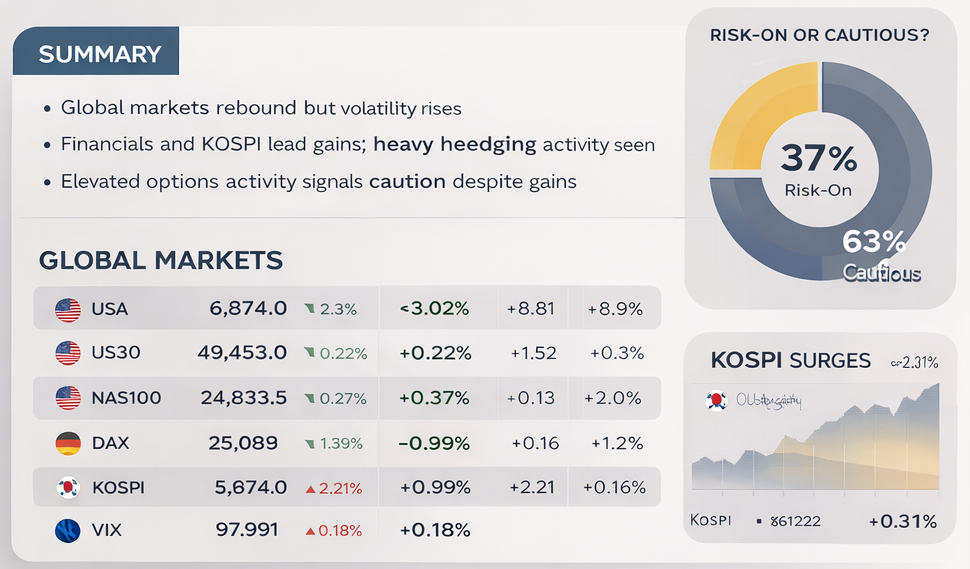
Global financial markets on 21 February 2026 displayed a broad risk-on tone as equity futures advanced across major economies while volatility declined sharply. US benchmarks led gains with technology stocks outperforming, supported by easing fear indicators as the VIX fell notably below the prior session. European markets also strengthened, suggesting improving sentiment toward global growth, while Asian markets showed mixed but generally constructive performance. Currency markets remained stable with only modest movements in major pairs, indicating balanced capital flows rather than panic repositioning. The overall environment reflected renewed confidence following recent uncertainty.
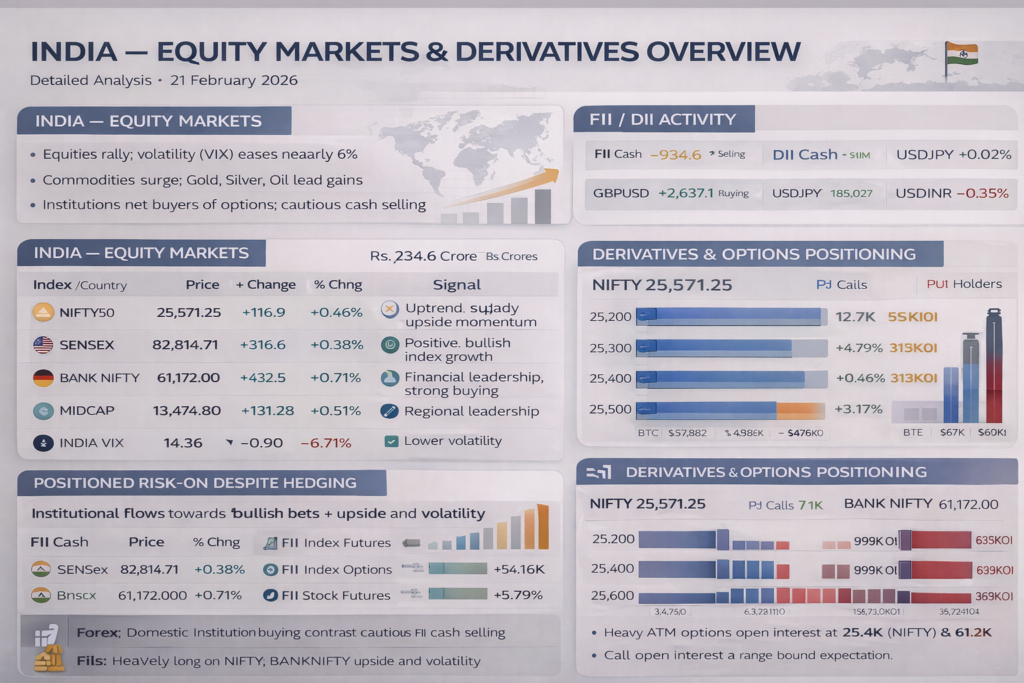
Indian equities continued their upward momentum with strong participation across banking, financial services, and midcap segments. Institutional activity revealed contrasting behavior: foreign investors sold cash equities but aggressively accumulated derivatives, while domestic institutions provided significant support. Rising India VIX alongside index gains indicated that traders were hedging profits rather than abandoning positions. Commodity markets rallied sharply, led by gold and silver, reinforcing the theme of inflation hedging despite equity strength. Cryptocurrency markets were mixed, showing both speculative surges in select tokens and mild weakness in major coins, suggesting rotation rather than broad enthusiasm.
| Instrument | Price | Change | % | Technical Movement | Key Event / Signal |
|---|---|---|---|---|---|
| US500 | 6,910.3 | +54.3 | +0.79% | Strong bullish | Tech-led rally |
| US30 | 49,612.0 | +266.0 | +0.54% | Uptrend continuation | Industrial strength |
| NAS100 | 25,011.9 | +246.5 | +1.00% | Breakout | Growth optimism |
| Euro Stoxx | 8,530.0 | +131.0 | +1.56% | Strong rebound | European recovery |
| DAX | 25,295 | +236 | +0.94% | Uptrend | Export optimism |
| Euro 50 | 6,136 | +78 | +1.29% | Positive momentum | Regional strength |
| Hang Seng | 26,413.36 | -292.59 | -1.10% | Weakness | China concerns |
| Nikkei | 57,103.1 | +68.9 | +0.12% | Consolidation | Mixed outlook |
| ASX 200 | 9,081.4 | -4.8 | -0.05% | Sideways | Commodity offset |
| KOSPI | 5,808.53 | +131.28 | +2.31% | Strong breakout | Regional leadership |
| DXY | 97.789 | -0.030 | -0.03% | Stable | Balanced flows |
| VIX | 19.09 | -1.14 | -5.64% | Volatility easing | Risk-on signal |
Technical Analysis:
Global equity markets displayed strong bullish momentum supported by a meaningful drop in volatility. NASDAQ futures led gains, signaling renewed appetite for growth assets. KOSPI’s surge indicated strong regional participation, while China’s weakness remained an outlier. Falling VIX below 20 suggests improving confidence but still elevated risk awareness.
Fundamental Analysis:
Broad gains across US and European markets imply expectations of resilient economic growth and stable monetary policy. Weakness in China-related markets reflects ongoing structural concerns. Stable dollar levels suggest no major shifts in global capital allocation.
Economic Announcements:
Recent data including housing statistics and sentiment indicators supported the outlook of moderate growth without overheating. Upcoming central bank speeches remain key catalysts for sustaining or reversing momentum.
| Pair | Price | Change | % | Technical Movement | Key Signal |
|---|---|---|---|---|---|
| EURUSD | 1.17775 | +0.00044 | +0.04% | Sideways | Balanced flows |
| GBPUSD | 1.34710 | +0.00080 | +0.06% | Stable | Neutral bias |
| USDJPY | 155.027 | +0.030 | +0.02% | Flat | Carry trade steady |
| USDINR | 90.6810 | -0.3170 | -0.35% | INR strengthening | Capital inflows |
Technical Analysis:
Major currency pairs traded in narrow ranges, indicating consolidation after recent moves. The rupee’s strengthening suggests supportive domestic flows or reduced external pressure.
Fundamental Analysis:
Limited movement reflects stable interest-rate expectations and absence of major macro shocks. Currency markets appear to be waiting for clearer policy signals.
Economic Announcements:
No immediate high-impact releases triggered sharp currency moves, reinforcing the calm conditions observed across FX markets.
| Asset | Price | Change | % | Technical Movement | Key Event |
|---|---|---|---|---|---|
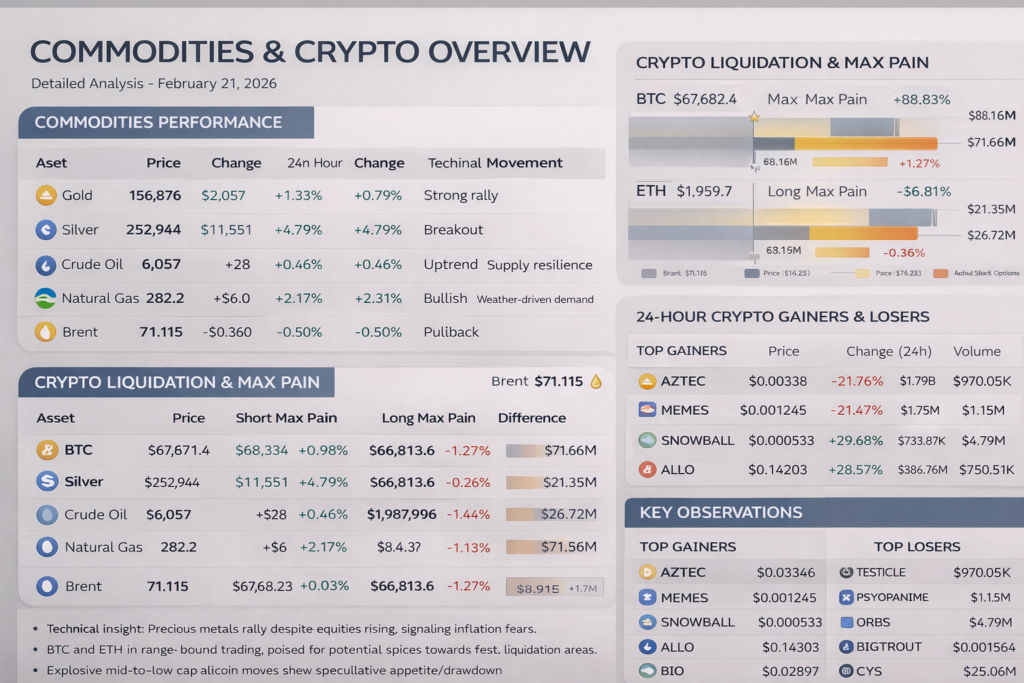
| Gold | 156,876 | +2,057 | +1.33% | Strong rally | Inflation hedge |
| Silver | 252,944 | +11,551 | +4.79% | Breakout | Industrial demand |
| Crude Oil | 6,057 | +28 | +0.46% | Uptrend | Supply resilience |
| Natural Gas | 282.2 | +6.0 | +2.17% | Bullish | Weather demand |
| Brent | 71.115 | -0.360 | -0.50% | Pullback | Profit-taking |
| BTC | 67,682 | -302 | -0.44% | Mild correction | Rotation |
| ETH | 1,959 | -9.1 | -0.46% | Consolidation | Neutral |
| SOL | 84.64 | +2.57 | +3.13% | Strong momentum | Altcoin strength |
| XRP | 1.4273 | -0.13% | Weakness | Mixed sentiment | |
| ZEC | 262.00 | +1.21% | Recovery | Privacy demand |
Technical Analysis:
Precious metals surged sharply, indicating strong safe-haven demand even as equities rallied — a sign of underlying inflation concerns. Crypto majors corrected modestly while select altcoins outperformed, suggesting capital rotation rather than exit.
Fundamental Analysis:
Commodity strength points toward persistent inflation expectations and resilient global demand. Energy prices remain supported by supply constraints and geopolitical factors.
Economic Announcements:
Rig count data and housing statistics influenced energy markets, while inflation expectations continued to support precious metals.
| Index | Price | Change | % | Technical Movement | Key Signal |
|---|---|---|---|---|---|
| NIFTY | 25,571.25 | +116.90 | +0.46% | Uptrend | Broad buying |
| SENSEX | 82,814.71 | +316.57 | +0.38% | Positive | Stability |
| BANKNIFTY | 61,172.00 | +432.45 | +0.71% | Strong rally | Banking leadership |
| FINNIFTY | 28,203.30 | +166.10 | +0.59% | Bullish | Financial strength |
| MIDCAP | 13,474.80 | +67.45 | +0.50% | Risk-on | Market breadth |
| INDIA VIX | 14.36 | +0.90 | +6.71% | Volatility rising | Hedging |
Technical Analysis:
Banking and financial stocks drove the rally, a sign of institutional participation. Rising volatility alongside gains suggests protective positioning rather than unrestrained optimism.
Fundamental Analysis:
Domestic growth expectations remain strong, supported by credit expansion and earnings resilience. Sectoral breadth confirms widespread participation.
Economic Announcements:
Global cues and institutional flows appear to be the primary drivers rather than domestic macro releases.
| Category | Net Flow (Rs Cr) | Signal |
|---|---|---|
| FII Cash | -934.61 | Selling |
| DII Cash | +2,637.15 | Strong buying |
| FII Index Futures | +696.13 | Bullish positioning |
| FII Index Options | +7,557.77 | Volatility play |
| FII Stock Futures | +5,116.57 | Positive outlook |
| FII Stock Options | +487.94 | Hedging |
Technical Analysis:
Derivative inflows indicate expectations of continued movement rather than decline. Domestic buying offset foreign selling, stabilizing markets.
Fundamental Analysis:
DII support suggests confidence in domestic fundamentals despite cautious foreign sentiment.
Economic Announcements:
Flows likely reflect positioning ahead of global policy signals rather than immediate data.
Key observations:
Technical Analysis:
Balanced positioning suggests market makers anticipate movement but not a clear directional bias.
Fundamental Analysis:
Strong banking participation aligns with equity leadership in financials.
Economic Announcements:
Options positioning reflects preparation for macro events and policy cues.
Key reported indicators:
Technical Analysis:
Housing strength supports cyclical sectors while weaker sentiment signals caution.
Fundamental Analysis:
Mixed data indicates moderate growth without overheating.
Economic Announcements:
Energy and housing indicators remain critical for inflation outlook.
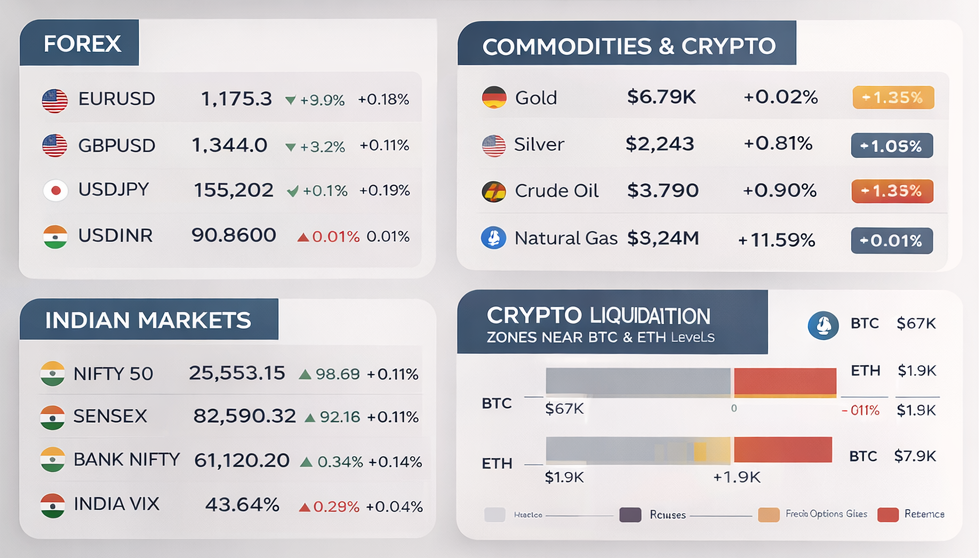
Large liquidation clusters exist around current BTC and ETH levels, indicating potential for sharp squeezes if prices move decisively.
Technical Analysis:
Proximity to liquidation zones increases volatility risk.
Fundamental Analysis:
Crypto markets remain leverage-driven rather than fundamentally anchored.
Economic Announcements:
Liquidity conditions and risk sentiment will dictate direction.
Top gainers showed extraordinary speculative moves, while major losers reflected profit-taking and rotation.
Technical Analysis:
High dispersion indicates speculative trading rather than trend-driven moves.
Fundamental Analysis:
Meme and small-cap tokens dominate gains, suggesting retail-driven activity.
Economic Announcements:
Crypto movements remain largely detached from traditional macro data.
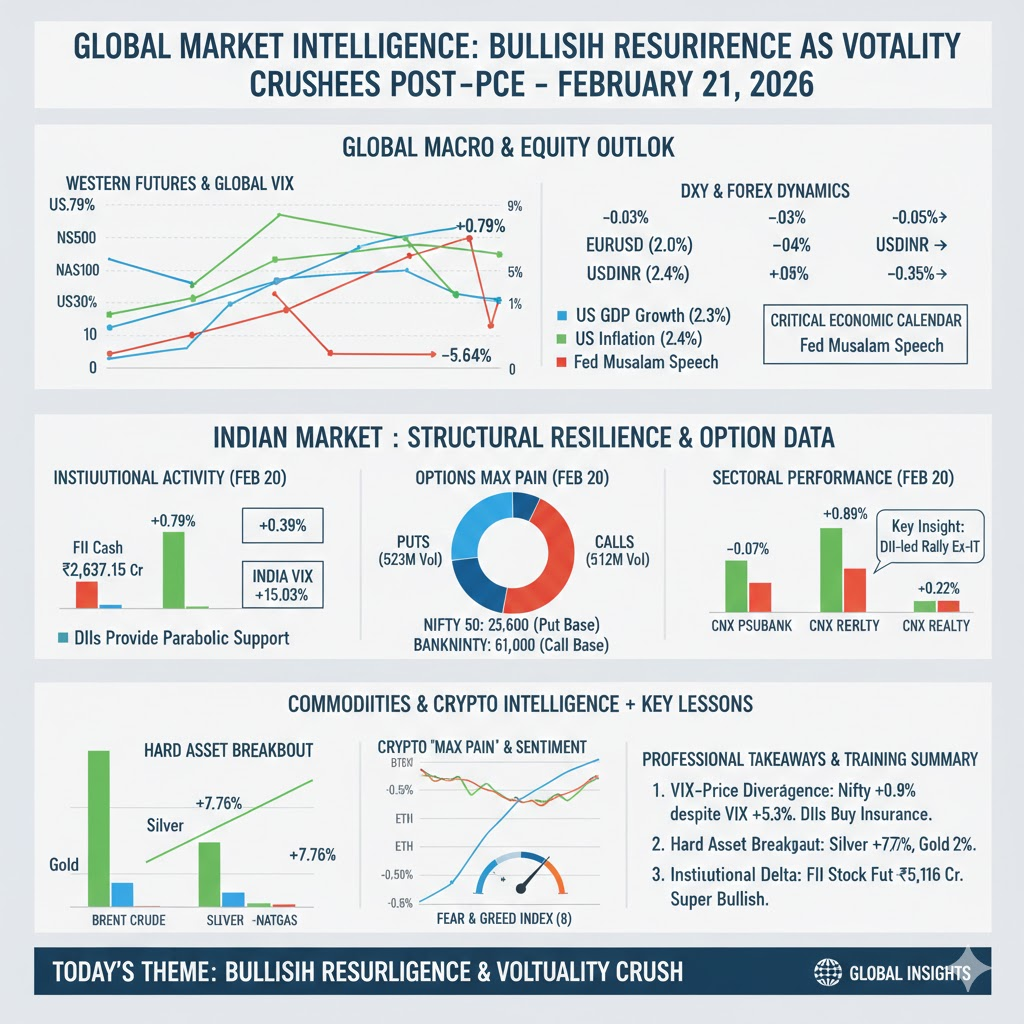
The market environment on 21 February 2026 highlights how rising equity prices can coexist with defensive signals such as elevated volatility, strong precious metals, and heavy derivatives hedging. For traders and analysts, this demonstrates the importance of evaluating cross-asset relationships rather than relying on a single indicator. Institutional flows, volatility trends, and commodity movements often provide early warnings about underlying sentiment shifts.
From a learning perspective, this session illustrates a classic risk-on rebound supported by domestic buying but constrained by cautious global positioning. Effective market interpretation requires integrating price action with macro context, flow data, and derivatives signals. Understanding these interactions helps professionals anticipate potential reversals, volatility spikes, or trend continuations before they become evident in headline index performance.
Legal Disclaimer & Liability Waiver
This AI-generated report is strictly educational and does not constitute financial, legal, or professional advice. aiTrendview and its affiliates are not SEBI-registered advisors and assume zero liability for any losses or consequences resulting from its use. All data is autonomously harvested from public sources and may be flawed, delayed, or incomplete; therefore, you assume exclusive responsibility for independently verifying information before taking any action. Under no circumstances should this content be construed as a recommendation to trade or speculate in any security. By accessing this material, you acknowledge that any reliance on this data is at your sole risk, and you agree to be bound by strict intellectual property protections prohibiting the unauthorized redistribution or modification of this work.