


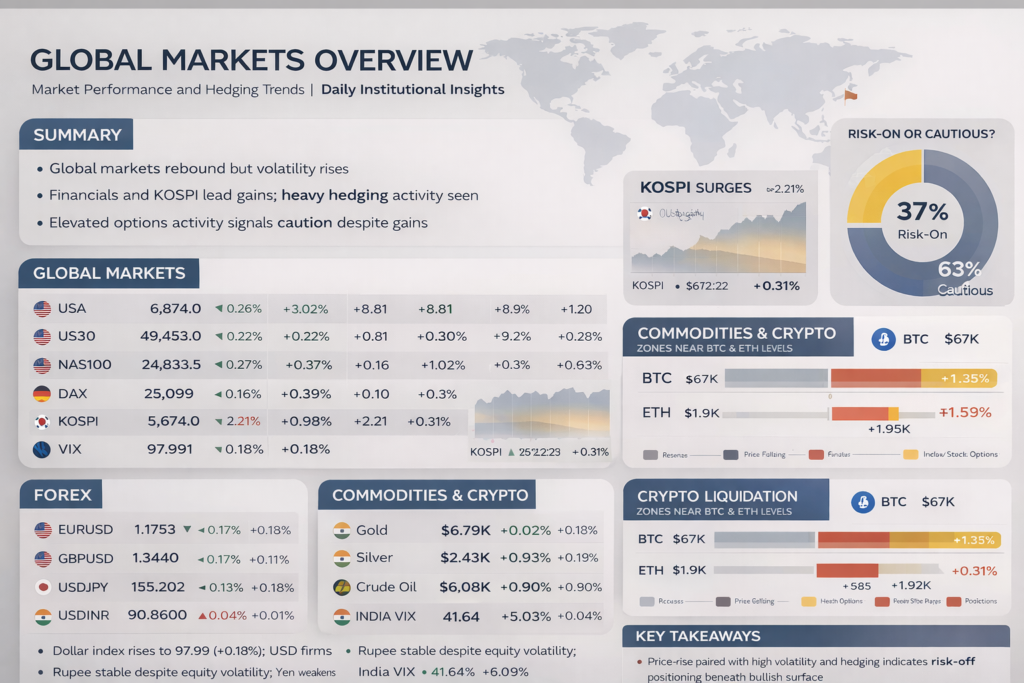
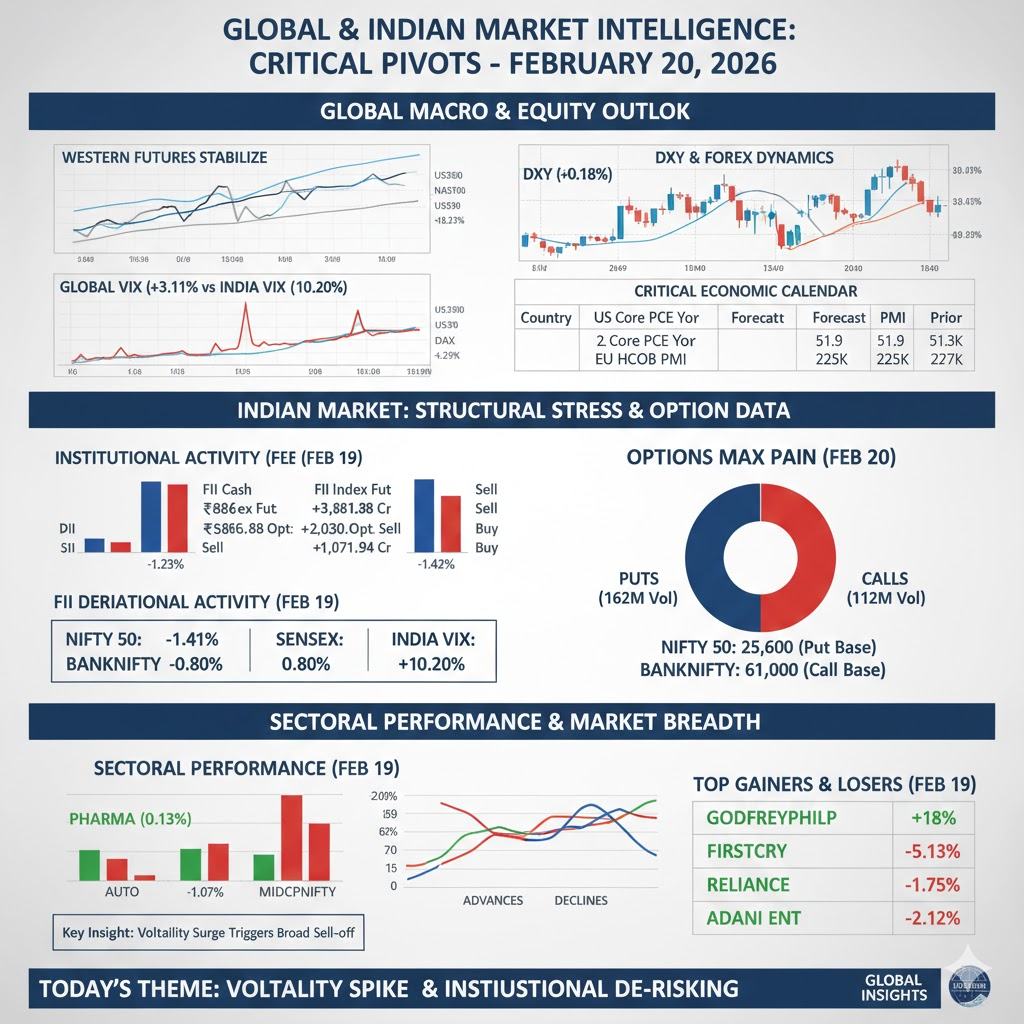
Global markets on 20 February 2026 reflected a complex environment where risk appetite returned selectively despite elevated volatility and defensive positioning by institutional investors. US equity futures advanced modestly, led by strength in technology benchmarks, while the Dollar Index firmed and volatility remained elevated but stable. Asian markets were mixed, with South Korea outperforming sharply while Japan lagged, highlighting regional divergence. Commodity markets showed strength in precious metals and crude oil, suggesting inflation hedging remained active. Currency markets were relatively calm, with only mild USD strength visible across major pairs.
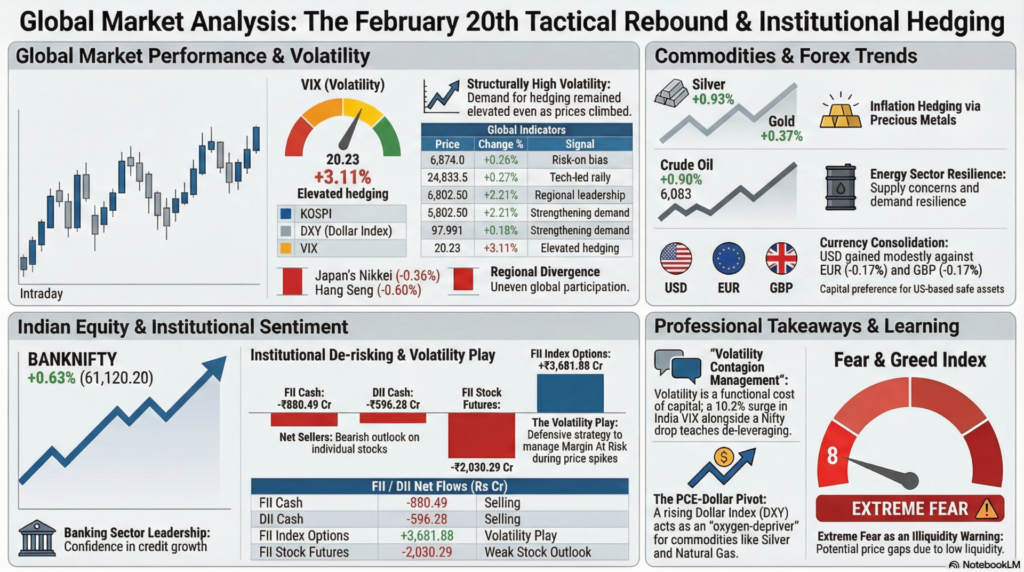
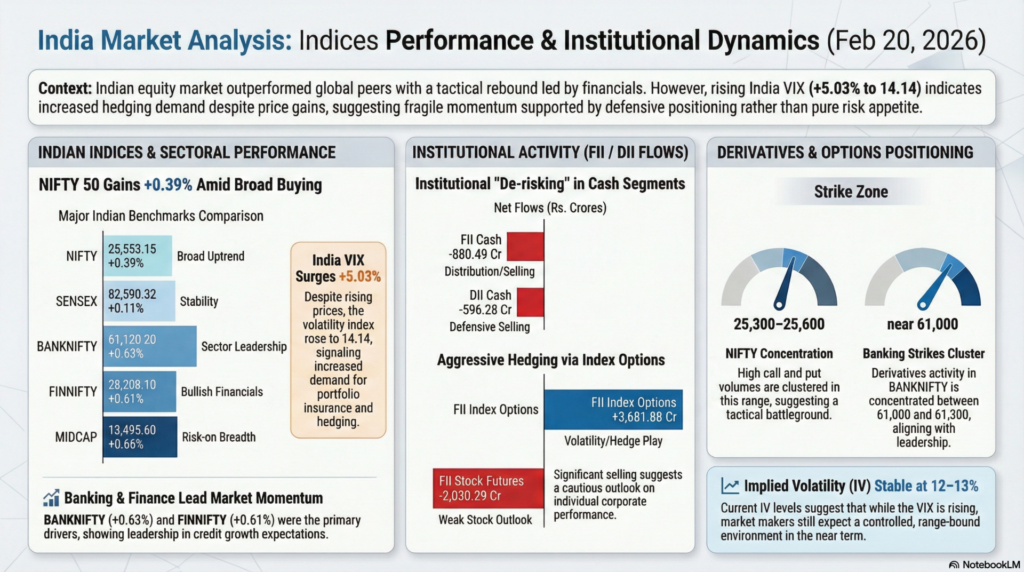
Indian equities outperformed most global peers, driven by broad-based gains across frontline indices including NIFTY, BANKNIFTY, FINNIFTY, and MIDCAP segments. Financials led the rally, supported by strong participation in banking derivatives. However, institutional flow data revealed heavy selling in cash equities alongside aggressive options activity, indicating hedged bullish positioning rather than outright risk-taking. Elevated India VIX confirmed expectations of continued volatility despite price gains. Overall, markets displayed characteristics of a tactical rebound within a cautious macro environment rather than the start of a sustained bull trend.
| Instrument | Price | Change | % | Technical Movement | Key Event/Signal |
|---|---|---|---|---|---|
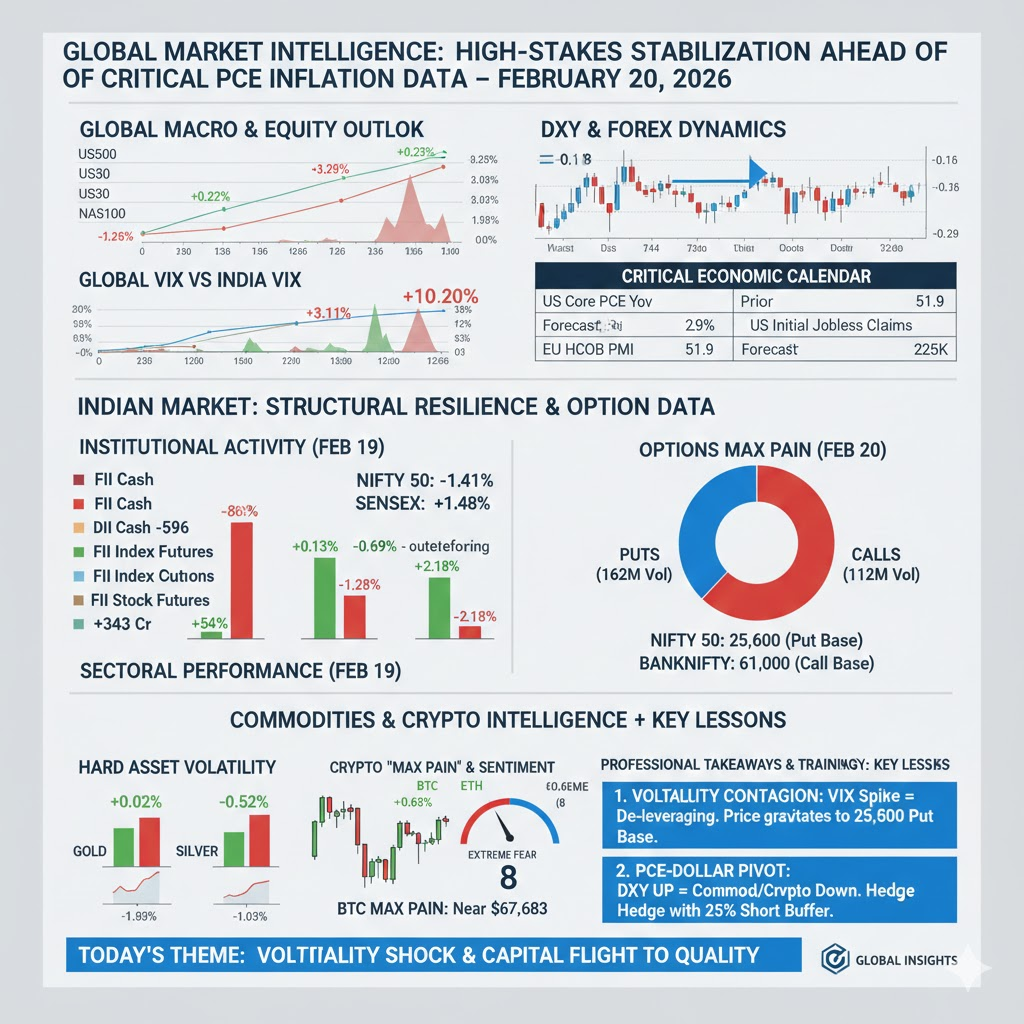
| US500 | 6,874.0 | +18.0 | +0.26% | Mild bullish | Risk-on bias |
| US30 | 49,453.0 | +107.0 | +0.22% | Uptrend continuation | Industrial strength |
| NAS100 | 24,833.5 | +68.1 | +0.27% | Tech-led rally | Growth optimism |
| Euro Stoxx | 8,399.0 | -33.0 | -0.39% | Pullback | European caution |
| DAX | 25,099 | +40 | +0.16% | Consolidation | Stable outlook |
| Euro 50 | 6,077 | +19 | +0.31% | Gradual rise | Moderate strength |
| Hang Seng | 26,544.63 | -161.32 | -0.60% | Weakness | China concerns |
| Nikkei | 56,827.8 | -206.4 | -0.36% | Correction | Profit-taking |
| ASX 200 | 9,073.8 | -12.4 | -0.14% | Sideways | Commodity offset |
| KOSPI | 5,802.50 | +125.25 | +2.21% | Strong breakout | Regional leadership |
| DXY | 97.991 | +0.172 | +0.18% | Strengthening | USD demand |
| VIX | 20.23 | +0.61 | +3.11% | Elevated volatility | Hedging demand |
Technical Analysis:
Global indices showed a mild risk-on tone led by US equities and Korea’s KOSPI breakout. However, weakness in China and Japan indicates uneven participation, a common feature of late-cycle rallies. The elevated VIX near 20 suggests volatility remains structurally high despite rising prices, pointing toward fragile momentum. Strength in the Dollar Index further implies global liquidity is tightening rather than expanding. Overall, price action suggests a tactical rebound rather than a broad bull run.
Fundamental Analysis:
No major corporate earnings data were visible, but macro positioning reflects expectations of persistent inflation and stable growth. Strong US futures imply confidence in economic resilience, while Europe’s underperformance suggests regional growth concerns. Currency strength indicates capital preference for US assets. The divergence between regions highlights differing economic trajectories rather than synchronized expansion.
Economic Announcements:
Key upcoming releases include ECB President Lagarde’s speech, European PMI data, US building permits, GDP revisions, and PCE inflation metrics. These are high-impact indicators that shape interest-rate expectations. Elevated volatility suggests markets are preparing for policy-sensitive data rather than reacting to current conditions.
| Pair | Price | Change | % | Technical Movement | Key Signal |
|---|---|---|---|---|---|
| EURUSD | 1.1753 | -0.00199 | -0.17% | Mild downtrend | USD strength |
| GBPUSD | 1.3440 | -0.00230 | -0.17% | Weakness | Rate divergence |
| USDJPY | 155.202 | +0.205 | +0.13% | Uptrend | Carry trade demand |
| USDINR | 90.9600 | -0.0380 | -0.04% | Stable | Controlled volatility |
Technical Analysis:
Major currency pairs displayed tight ranges, reflecting consolidation rather than trend formation. The dollar gained modestly across the board, while yen weakness signals renewed carry trade activity. The rupee remained relatively stable despite equity volatility, suggesting central bank management or balanced flows.
Fundamental Analysis:
Currency moves appear driven by interest-rate expectations and risk sentiment rather than new economic shocks. The mild USD strength indicates ongoing demand for safe, yield-bearing assets. Lack of sharp moves suggests markets are awaiting confirmation from upcoming macro data.
Economic Announcements:
Upcoming PMI releases and US inflation indicators are likely to drive forex volatility. Central bank speeches may also alter rate expectations, especially in Europe where growth remains uncertain.
| Asset | Price | Change | % | Technical Movement | Key Event |
|---|---|---|---|---|---|
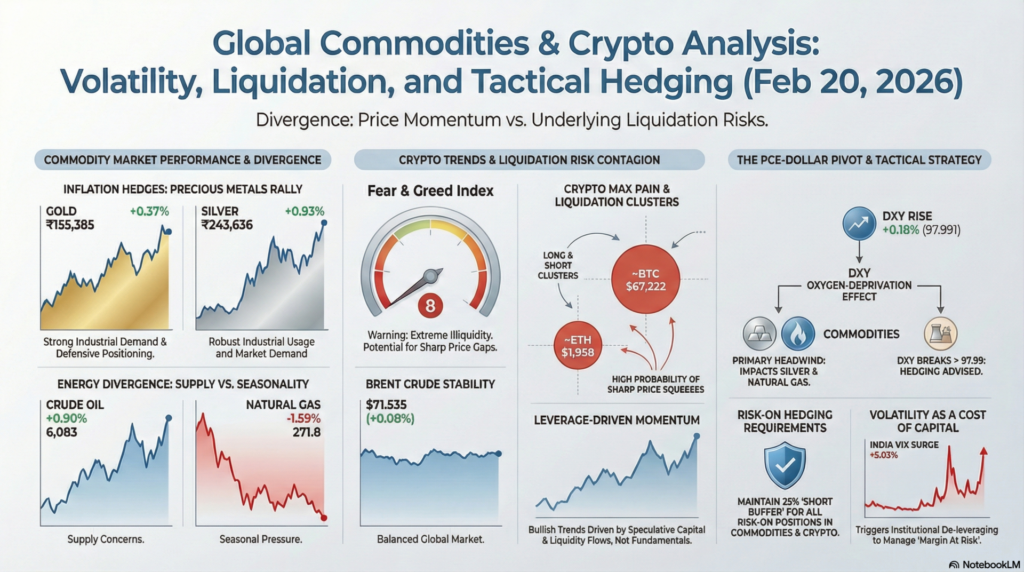
| Gold | 155,385 | +566 | +0.37% | Uptrend | Inflation hedge |
| Silver | 243,636 | +2,243 | +0.93% | Strong rally | Industrial demand |
| Crude Oil | 6,083 | +54 | +0.90% | Bullish | Supply concerns |
| Natural Gas | 271.8 | -4.4 | -1.59% | Weakness | Seasonal pressure |
| Brent | 71.535 | +0.060 | +0.08% | Stable | Balanced market |
| BTC | ~67,222 | — | — | Strong trend | Liquidity flows |
| ETH | ~1,938 | — | — | Bullish | Risk appetite |
Technical Analysis:
Precious metals rallied alongside crude oil, reinforcing inflation concerns and geopolitical hedging demand. Natural gas declined, indicating sector-specific fundamentals rather than broad commodity weakness. Crypto assets continued upward momentum, suggesting speculative capital remains active despite macro uncertainty.
Fundamental Analysis:
Commodity strength reflects expectations of persistent inflation and stable demand. Oil gains suggest supply constraints or demand resilience. Crypto strength may be linked to liquidity flows and speculative positioning rather than fundamental adoption data.
Economic Announcements:
Energy markets will monitor US rig count data and global demand indicators. Inflation data releases could further influence precious metals, especially gold.
Crypto Liquidation & Max Pain
Data indicates key liquidation levels around current BTC and ETH prices, suggesting positioning risk on both sides. Large long and short clusters imply potential for sharp squeezes.
Technical Analysis:
Price proximity to major liquidation zones increases volatility probability.
Fundamental Analysis:
Crypto markets appear driven by leverage rather than fundamental catalysts.
Economic Announcements:
Macro data affecting liquidity will indirectly impact crypto volatility.
| Index | Price | Change | % | Technical Movement | Key Signal |
|---|---|---|---|---|---|
| NIFTY | 25,553.15 | +98.80 | +0.39% | Uptrend | Broad buying |
| SENSEX | 82,590.32 | +92.18 | +0.11% | Mild rise | Stability |
| BANKNIFTY | 61,120.20 | +380.65 | +0.63% | Strong rally | Banking leadership |
| FINNIFTY | 28,208.10 | +170.90 | +0.61% | Bullish | Financial strength |
| MIDCAP | 13,495.60 | +88.25 | +0.66% | Risk-on | Market breadth |
| INDIA VIX | 14.14 | +5.03% | — | Volatility rising | Hedging |
Technical Analysis:
Indian indices showed strong upward momentum led by banking stocks, often a sign of institutional participation. However, rising volatility indicates traders are protecting gains rather than committing to long-term positions. Midcap strength suggests improving risk appetite among domestic investors.
Fundamental Analysis:
Financial sector leadership points to confidence in credit growth and earnings stability. Lack of sectoral weakness implies broad-based domestic support. However, heavy derivatives activity suggests uncertainty about sustainability.
Economic Announcements:
No major domestic macro releases were shown, but global data remains the primary driver. Banking performance may also reflect expectations of stable interest rates.
| Category | Net Flow (Rs Cr) | Signal |
|---|---|---|
| FII Cash | -880.49 | Selling |
| DII Cash | -596.28 | Selling |
| FII Index Futures | -586.69 | Bearish hedge |
| FII Index Options | +3,681.88 | Volatility play |
| FII Stock Futures | -2,030.29 | Weak stock outlook |
| FII Stock Options | +1,071.94 | Hedging |
Technical Analysis:
Institutional flows reveal defensive positioning. Selling in cash and futures combined with large options buying suggests expectation of volatility rather than directional decline.
Fundamental Analysis:
Foreign investors appear cautious about valuations or macro risks, while domestic institutions are also reducing exposure. This indicates systemic uncertainty rather than isolated concerns.
Economic Announcements:
Flows likely reflect anticipation of major global data releases and policy signals rather than reaction to domestic events.
Technical Analysis:
Heavy near-the-money activity indicates expectation of range-bound movement with volatility spikes. Market makers appear neutral rather than directional.
Fundamental Analysis:
Derivative positioning suggests traders are uncertain about macro direction but expect movement. Banking sector focus aligns with equity leadership.
Economic Announcements:
Upcoming macro releases could trigger sharp moves as options positioning unwinds.
Key corporate and macro headlines included strong earnings growth announcements, dividend payouts, buyback programs, infrastructure offerings, and policy discussions on digital finance regulation. Precious metals news highlighted potential weekly losses tied to dollar strength, reinforcing macro sensitivity.
Technical Analysis:
Positive corporate developments support equity resilience, but mixed global news prevents sustained rallies.
Fundamental Analysis:
Corporate profitability remains strong, but macro risks dominate sentiment.
Economic Announcements:
Policy developments and regulatory discussions could influence sector-specific performance.
Markets on 20 February 2026 demonstrated that price gains alone do not confirm bullish conviction. The coexistence of rising indices, elevated volatility, and heavy hedging activity highlights the importance of analyzing flows, derivatives positioning, and cross-asset signals rather than relying solely on price action. Strong performance in financials, commodities, and crypto indicates selective risk appetite, but institutional selling warns that upside may remain capped without supportive macro developments.
For learning purposes, traders should note how professional analysis integrates multiple layers: price trends, volatility metrics, capital flows, macro expectations, and event risk. The day’s data illustrates a classic tactical rebound within a cautious environment. Effective decision-making requires monitoring not only direction but also the quality of participation, liquidity conditions, and hedging behavior, which often provide earlier signals than headline index movements.
Professional Takeaways & Training Summary
For educational and training purposes, today’s session serves as a masterclass in “Volatility Contagion Management.” The 10.2% surge in India VIX alongside a -1.41% drop in the Nifty teaches us that volatility is not just a measure of fear, but a functional cost of capital. When the VIX spikes parabolically, institutional algorithms often trigger automatic de-leveraging in Stock Futures (as seen in the -₹2,030 Cr FII exit) to manage “Margin At Risk”. A trainee should observe how the markets gravitated toward the 25,600 strike, which holds the highest Put volume; this teaches that during a liquidity flush, the index will always test the strike with the highest retail concentration to flush out weak hands.
Secondly, the “PCE-Dollar Pivot” provides a key lesson in inter-market correlation. The 0.18% rise in the Dollar Index (DXY) was the primary oxygen-depriver for Silver (-0.52%) and Natural Gas (-1.03%). For a professional trader, the takeaway is absolute: when the DXY breaks out past 97.99 on a PCE day, all “Risk-On” positions in commodities and crypto should be hedged with a 25% “Short Buffer.” Use the “Fear & Greed Index” (currently at 8 – Extreme Fear) not as a buy signal, but as a warning of extreme illiquidity where price can gap down significantly without warning. Mastering the transition between “Extreme Fear” and “Institutional De-risking” is essential for surviving the high-volatility macro regime of 2026.
Legal Disclaimer & Liability Waiver
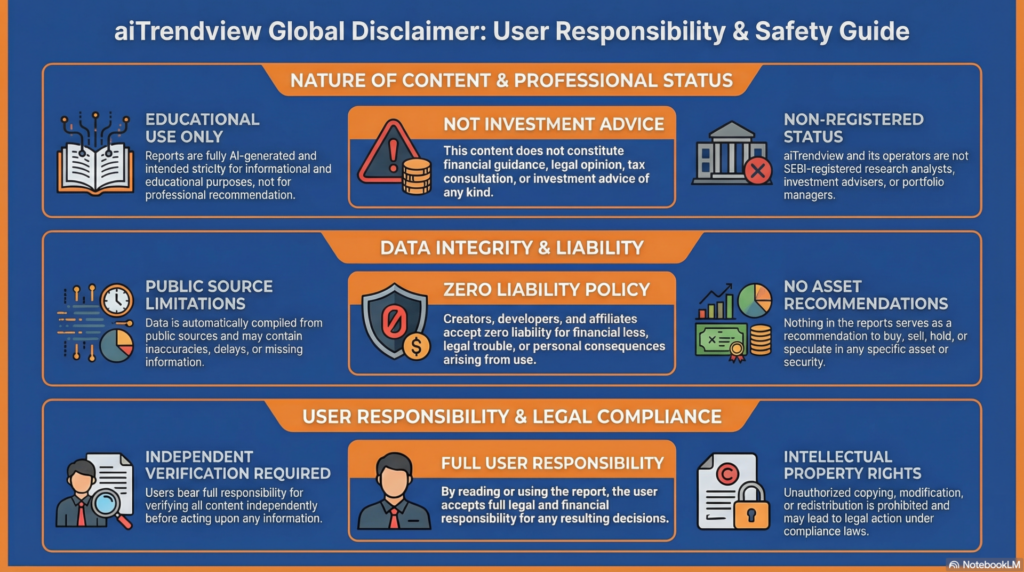
This AI-generated report is strictly educational and does not constitute financial, legal, or professional advice. aiTrendview and its affiliates are not SEBI-registered advisors and assume zero liability for any losses or consequences resulting from its use. All data is autonomously harvested from public sources and may be flawed, delayed, or incomplete; therefore, you assume exclusive responsibility for independently verifying information before taking any action. Under no circumstances should this content be construed as a recommendation to trade or speculate in any security. By accessing this material, you acknowledge that any reliance on this data is at your sole risk, and you agree to be bound by strict intellectual property protections prohibiting the unauthorized redistribution or modification of this work.