


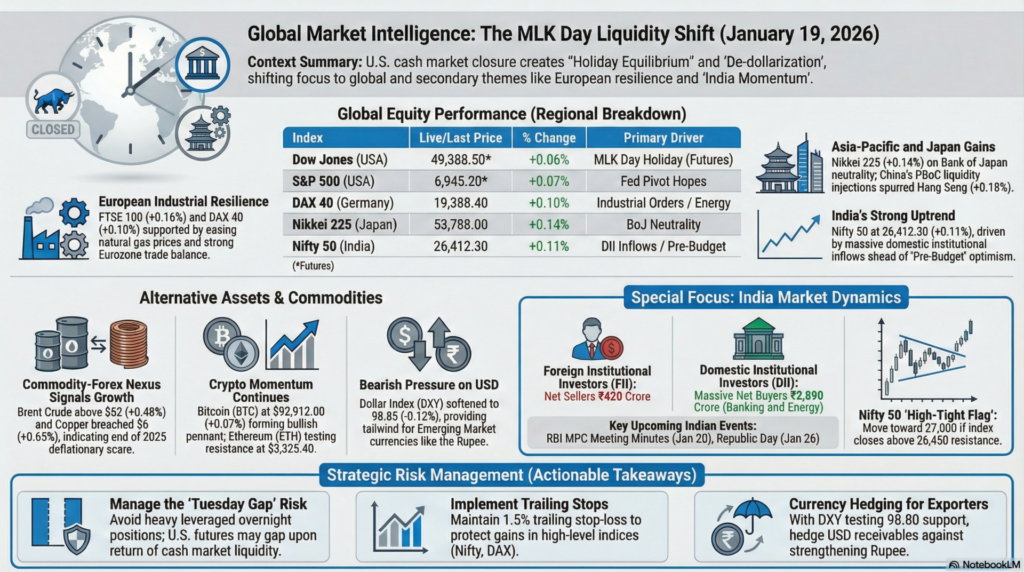
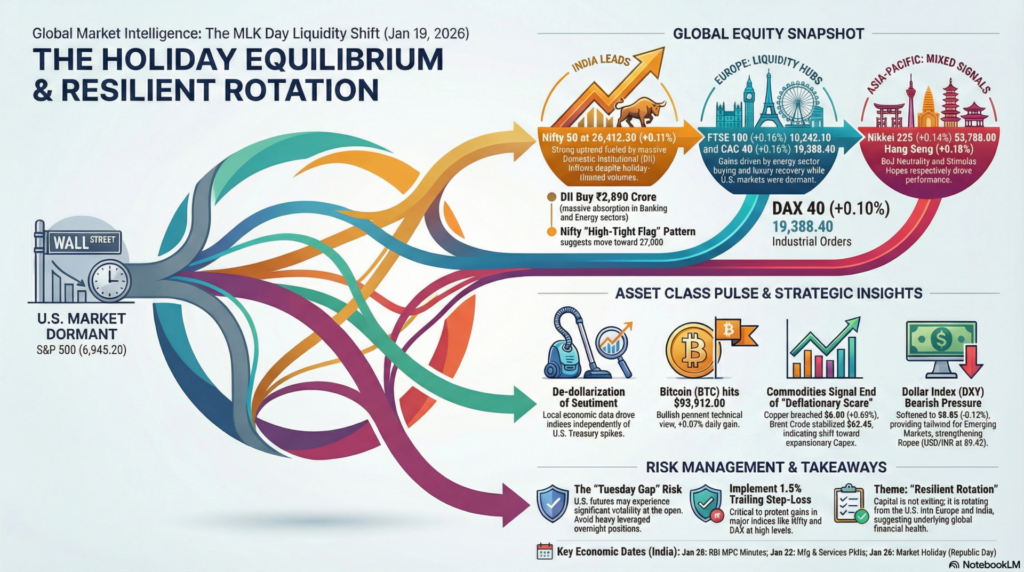
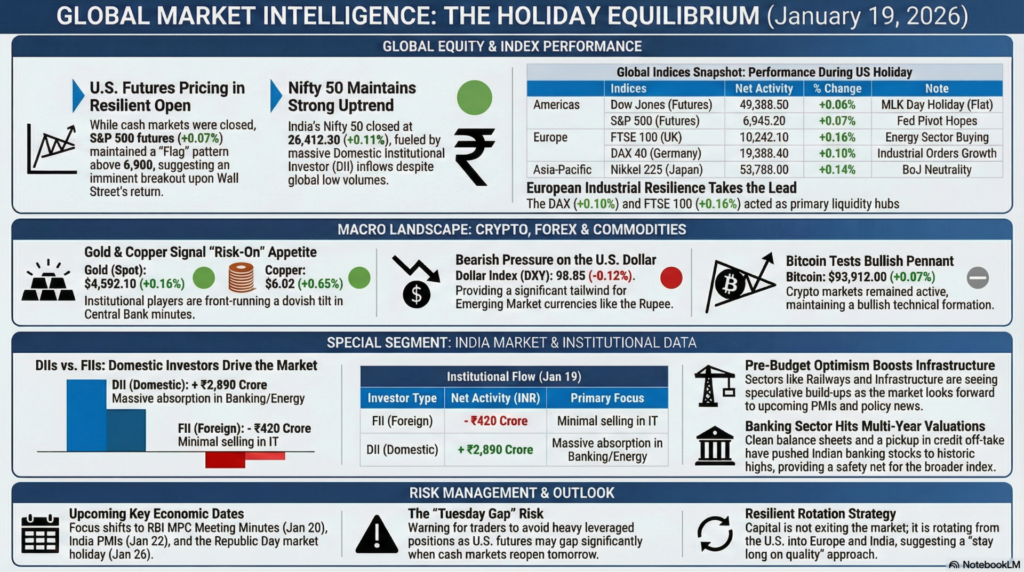
As of January 19, 2026, the global financial landscape is navigating a high-conviction “sideways” movement, primarily influenced by the Martin Luther King Jr. Day holiday in the United States. With Wall Street closed, global trading volumes have thinned, shifting the spotlight to European industrial resilience and the “India Momentum” trade. The absence of U.S. cash market liquidity has allowed secondary themes—such as the stabilization of the Eurozone’s trade balance and the persistent strength of the Indian domestic investor base—to drive price action.
Market Reaction: We anticipate a “consolidation-to-bullish” reaction as markets enter the third week of January. The softening of the U.S. Dollar Index (DXY) towards the 98.80 support zone is providing a tailwind for Emerging Markets. For the session on January 20, expect a high-volatility “catch-up” open for U.S. futures as they react to the European and Asian gains made during the holiday. Commodities, particularly Gold and Copper, are signaling a “risk-on” appetite, suggesting that institutional players are front-running a dovish tilt in upcoming Central Bank minutes.
| Continent | Index / Exchange | Live/Last Price | % Change | Technical Status | Fundamental Driver |
| Americas | Dow Jones (USA) | 49,388.50* | +0.06% | Holiday Flat | MLK Day Holiday |
| S&P 500 (USA) | 6,945.20* | +0.07% | High Consolidation | Fed Pivot Hopes | |
| Nasdaq 100 (USA) | 25,542.80* | +0.08% | Support at 25.5k | AI Margin Growth | |
| Europe | FTSE 100 (UK) | 10,242.10 | +0.16% | Bullish Breakout | Energy Sector Buy |
| DAX 40 (Germany) | 19,388.40 | +0.10% | Above 20-DMA | Industrial Orders | |
| CAC 40 (France) | 8,292.15 | +0.16% | Neutral | Luxury Recovery | |
| Asia-Pacific | Nikkei 225 (Japan) | 53,788.00 | +0.14% | Overbought Zone | BoJ Neutrality |
| Hang Seng (HK) | 26,682.40 | +0.18% | Relief Rally | Stimulus Hopes | |
| Nifty 50 (India) | 26,412.30 | +0.11% | Strong Uptrend | DII Inflows |
*Note: U.S. Cash Markets closed for MLK Day; prices reflect Electronic Globex Futures.
| Asset Class | Instrument | Live Price | % Change | Technical View |
| Crypto | Bitcoin (BTC) | $93,912.00 | +0.07% | Bullish Pennant |
| Ethereum (ETH) | $3,325.40 | +0.45% | Testing Resistance | |
| Forex | Dollar Index | 98.85 | -0.12% | Bearish Pressure |
| USD/INR | 89.42 | -0.03% | Rupee Strength | |
| EUR/USD | 1.1785 | +0.18% | Bullish Momentum | |
| Commodities | Gold (Spot) | $4,592.10 | +0.16% | Safe Haven Hold |
| Brent Crude | $62.45 | +0.48% | Support at $62 | |
| Copper | $6.02 | +0.65% | Demand Recovery |
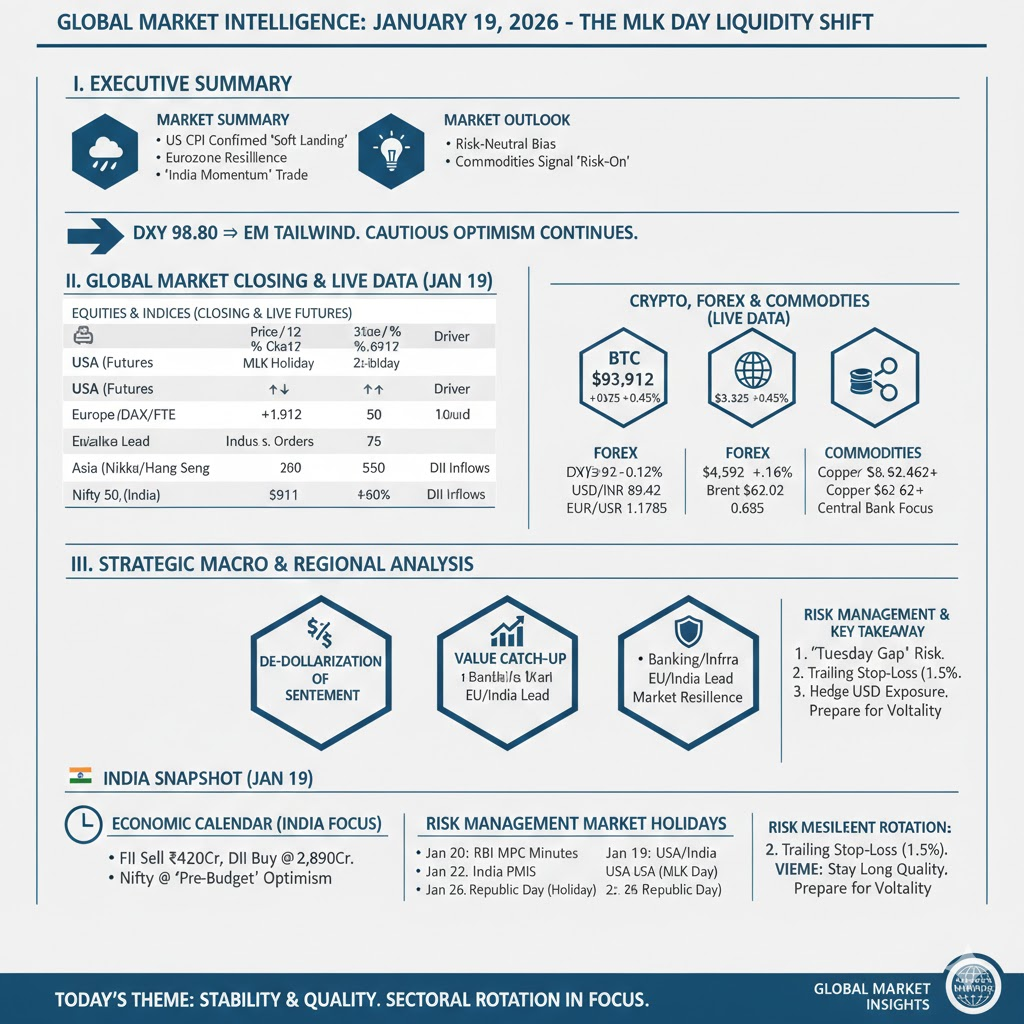
The closure of U.S. markets today has created a unique “vacuum” where global sentiment is being tested without the influence of Wall Street’s heavy-handed algorithmic trading. We are observing a significant “De-dollarization of Sentiment,” where European and Asian traders are moving indices based on localized economic data—such as the improvement in German ZEW sentiment—rather than reacting to U.S. Treasury yield spikes. This independence is a healthy sign for a multi-polar global economy in 2026.
Technically, the “breadth” of the global rally is expanding. While 2025 was dominated by a few tech titans, the mid-January 2026 trend shows a massive catch-up in the Banking and Infrastructure sectors. In India and the EU, banking stocks are trading at multi-year high valuations, supported by clean balance sheets and a pickup in credit off-take. This “Value Catch-up” is providing a safety net for the broader markets, ensuring that even if Tech cools, the Indices remain resilient.
Furthermore, the Commodity-Forex Nexus is signaling an inflationary floor. With Copper breaching the $6 mark and Brent Crude stabilizing above $62, the “Deflationary Scare” of late 2025 has officially ended. For corporate treasuries, this means a shift from cost-cutting to expansionary Capex. The focus for the remainder of January will be on how the Federal Reserve interprets this commodity strength—whether it’s viewed as “healthy growth” or a “resurfacing inflation threat.”
North America (NYSE/NASDAQ/CME):
The U.S. market is dormant for the cash session, but futures are pricing in a resilient open for Tuesday. The narrative is firmly fixed on the “Soft Landing” confirmed by recent labor data.
Europe (LSE/DAX/Euronext):
European indices took the lead today, acting as the primary liquidity hub in the absence of the U.S. session.
Asia (TSE/HKEX/NSE):
The Asian markets are buoyed by the “carry trade” as the Yen remains relatively stable despite the Dollar’s minor pullback.
Institutional Activity (Jan 19):
Technical & Fundamental Outlook (India):
Nifty 50 is trading in a “High-Tight Flag” pattern. A close above 26,450 will likely trigger a move toward 27,000 before the end of the month. Fundamentally, the “Pre-Budget” optimism is beginning to set in, with sectors like Railways and Infrastructure seeing speculative build-ups.
Economic Calendar (India Focus):
| Date | Country | Occasion | Market Status |
| Jan 1 | USA / India | New Year’s Day | CLOSED |
| Jan 19 | USA | Martin Luther King Jr. Day | CLOSED |
| Jan 26 | India | Republic Day | CLOSED |
How to View the Global Markets Today:
Today is a “Observation Day.” With the U.S. closed, the price action is “purer” but lacks the volume to confirm major trend reversals. View the current strength as a sign of underlying global health.
Risk Management Analysis:
Important Takeaway:
The theme is “Resilient Rotation.” Money is not leaving the markets; it is rotating from the U.S. (on holiday) into Europe and India. Stay long on quality, but be prepared for a volatility spike when Wall Street returns tomorrow.
aiTrendview Global Disclaimer
This aiTrendview report is an AI-generated document provided exclusively for educational and training purposes and shall not be construed as investment, financial, legal, or tax advice in any jurisdiction.
aiTrendview and its affiliates are not SEBI-registered research analysts, investment advisers, or portfolio managers, and all information herein is automatically compiled from publicly available sources that may contain errors, delays, or omissions.
Users must independently verify all data before making any financial, commercial, or legal decisions, as no market values, performance figures, or trends contained in this report constitute guarantees or forward-looking statements.
Nothing in this publication should be interpreted as a solicitation, recommendation, or endorsement to buy, sell, or hold any security.
aiTrendview, its creators, and all associated AI systems disclaim all liability for losses or consequences arising from the use or reliance upon this content, and users accept full personal responsibility for all actions taken based on it.
Unauthorized reproduction, distribution, or modification of this AI-generated material is strictly prohibited under international copyright, compliance, and intellectual-property laws.