


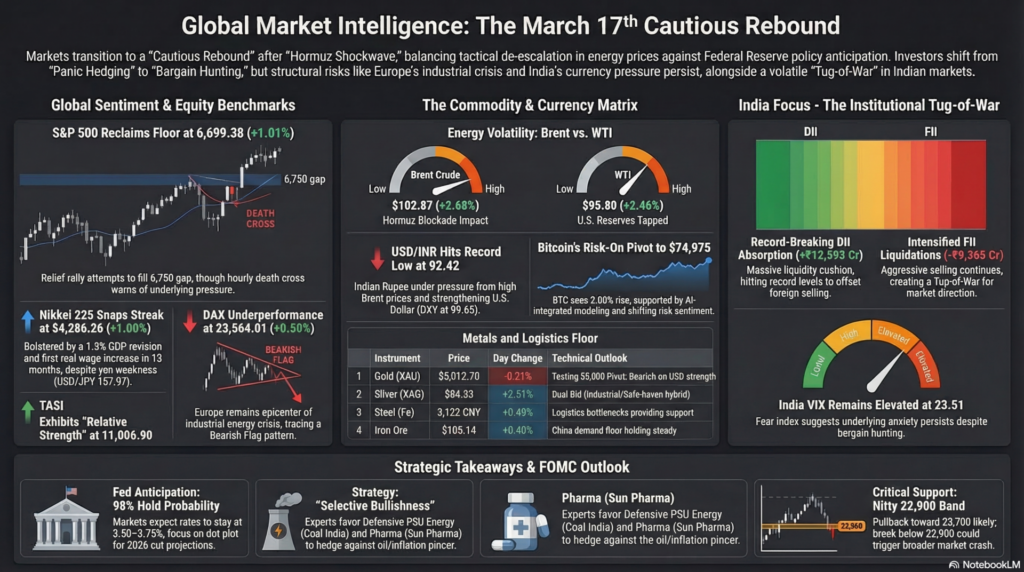
The global financial landscape on Tuesday, March 17, 2026, is characterized by a “Cautious Rebound” as investors balance a significant cooling in energy prices with the start of the U.S. Federal Reserve’s two-day policy meeting. After a period of extreme volatility triggered by the “Hormuz Shockwave,” major benchmarks like the Nasdaq 100 (+1.2%) and S&P 500 (+1.0%) staged their strongest sessions in weeks. The narrative has shifted from “Panic Hedging” to “Bargain Hunting,” although the India VIX remains elevated at 23.51, suggesting that the underlying fear has not yet fully dissipated. While the UAE reopening its airspace provides a tactical de-escalation signal, the physical blockade of the Strait of Hormuz remains a structural “War Premium” for Brent Crude, which is currently oscillating near $102.87/bbl.
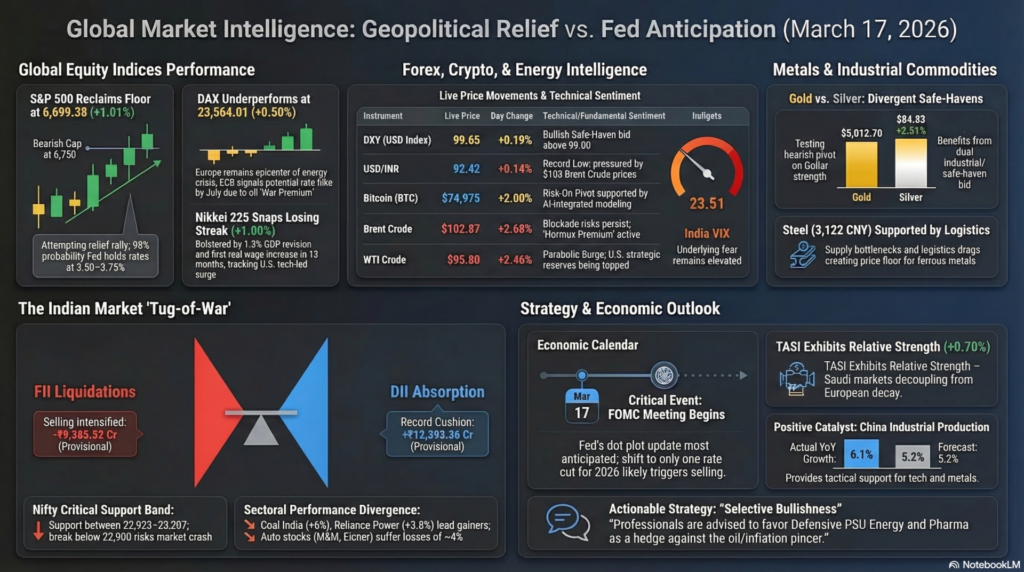
The S&P 500 closed the Monday session at 6,699.38 (+1.01%), reclaiming its psychological floor after a violent week of de-leveraging. Technically, the index is attempting a “relief rally” to fill the bearish gap left near 6,750, though a “death cross” on the hourly chart warns of persistent downward pressure. Fundamentally, the market is pricing in a 98% probability of the Fed holding rates at 3.50–3.75% this week, with focus shifting to the updated dot plot. Resistance is firmly capped at 6,780, while major support now resides at 6,550. If the Fed signals only one rate cut for 2026 (down from three previously), we expect a secondary wave of selling. Current sentiment is “Neutral-Bullish” for the short term, but high energy costs continue to threaten core margin stability.
Europe’s DAX Index closed at 23,564.01 (+0.50%), underperforming its U.S. peers as it remains the epicenter of the energy-driven industrial crisis. Technically, the index is tracing a “Bearish Flag” pattern, with the reclaim of 23,500 being viewed as a tactical rather than a structural turnaround. Fundamentally, the ECB’s Christine Lagarde has signaled that the “War Premium” in oil may force a rate hike by July, a hawkish pivot that is crushing the valuation of high-beta industrials. Support is stationed at 23,200, while resistance at 24,100 appears impenetrable without a full resolution of the Gulf blockade. Investors are currently favoring defensive utilities over cyclical autos.
Japan’s Nikkei 225 opened the Tuesday session at 54,286.26 (+1.00%), snapping its losing streak as it tracks the Nasdaq’s tech-led surge. The index is fundamentally bolstered by a 1.3% GDP revision and the first real wage increase in 13 months, providing a rare internal growth catalyst amid external shocks. Technically, the Nikkei has formed a “Bullish Piercing” candle, but a significant gap at 54,500 remains a major overhead resistance. Support is firmly established at 52,800. Traders are closely watching the USD/JPY (157.97); any further yen weakness would exacerbate the oil import bill and cap the equity recovery.
The Saudi TASI is exhibiting “Relative Strength,” currently trading near 11,006.90 (+0.70%) as it remains the primary beneficiary of the oil super-cycle. Fundamentally, the index is powered by massive fiscal windfall and high dividend yields from Aramco, effectively decoupling it from the “Stagflationary Decay” seen in Europe. Technically, the TASI is in a textbook uptrend, with support at 10,800 and its next major target at 11,350. While Gulf news headlines regarding drone strikes in Fujairah (UAE) caused minor intraday ripples, the index recovered quickly, suggesting that institutional buyers are using dips to accumulate energy-heavy portfolios.
| Instrument | Live Price/Rate | Day Change (%) | Support | Resistance | Tech/Fund Analysis |
| DXY (USD Index) | 99.65 | +0.19% | 98.80 | 100.20 | Safe-Haven Bid. Bullish above 99.00. |
| USD/INR | 92.42 | +0.14% | 92.10 | 93.50 | Record Low. Pressure from $103 Brent. |
| Bitcoin (BTC) | $74,975 | +2.00% | $68,600 | $78,000 | Risk-On Pivot. AI-integrated modeling boost. |
| Brent Crude | $102.87 | +2.68% | $98.50 | $114.00 | Hormuz Premium. Blockade risk persists. |
| WTI Crude | $95.80 | +2.46% | $90.00 | $105.00 | Parabolic Surge. US reserves tapped. |
| Commodity | Price | Day Change (%) | Support | Resistance | Technical Detail |
| Gold (XAU) | $5,012.70 | -0.21% | $5,000 | $5,150 | Testing Pivot. Bearish on Dollar strength. |
| Silver (XAG) | $84.33 | +2.51% | $80.00 | $90.00 | Dual Bid. Industrial/Safe-haven hybrid. |
| Steel (Fe) | 3,122 CNY | +0.40% | 3,050 | 3,250 | Logistics Drag. Supply bottlenecks support. |
| Iron Ore | $105.14 | +0.40% | $100.00 | $112.00 | China Support. Demand floor holding. |
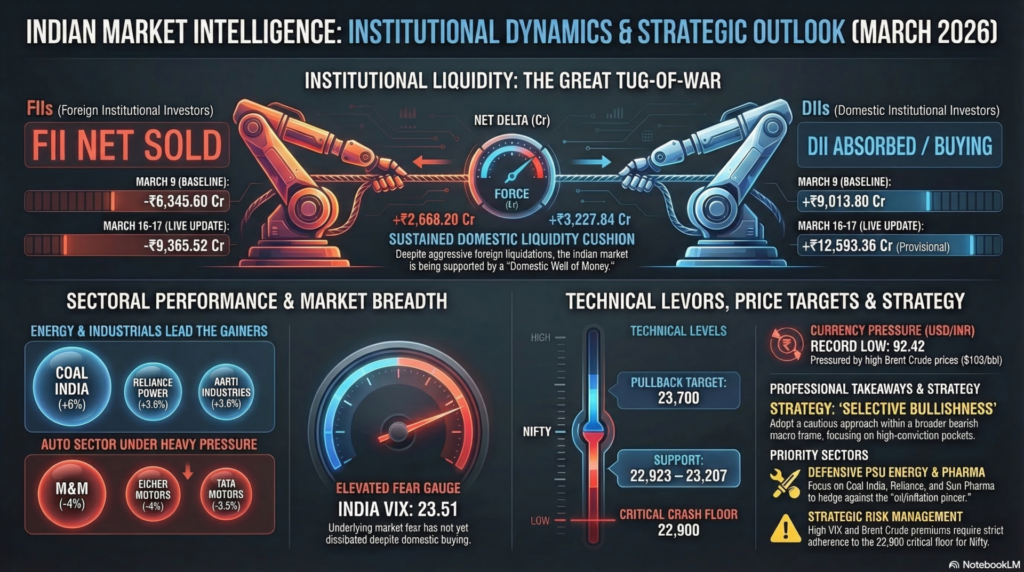
The Indian market is currently in a “Tug-of-War” between massive foreign selling and even larger domestic absorption.
| Time (IST) | Country | Event | Actual | Forecast | Impact |
| 07:30 AM | China | Industrial Production (YoY) | 6.1% | 5.2% | High (Supportive) |
| 06:45 PM | US | NY Empire State Mfg Index | -2.5 | 1.1 | Medium |
| All Day | US | FOMC Meeting Begins | — | 3.5-3.75% | Critical |
For the March 17 session, the strategy is “Selective Bullishness” within a broader bearish macro frame. The Nasdaq’s 1.2% rebound and better-than-expected China data provide a tactical window for gains in tech and metals. However, the India VIX (23.5) and Brent ($102) signal that structural risks are high.
Legal Disclaimer & Liability Waiver – aiTrendview.com
All content, reports, signals, analytics, forecasts, and materials published on aiTrendview.com are fully AI-generated outputs produced through automated systems with zero human research, manual validation, editorial review, or professional intervention. This platform does not provide financial, investment, trading, legal, tax, or professional advice of any kind. aiTrendview.com, its owners, affiliates, and associated entities are not registered with SEBI or any other regulatory authority as investment advisors, research analysts, brokers, or financial consultants. All data is autonomously aggregated from publicly available sources and algorithmic processes that may contain inaccuracies, delays, omissions, or technical errors. Users are solely and exclusively responsible for independently verifying all information before making any financial, legal, or commercial decisions.
By accessing or using this platform, you expressly acknowledge and agree that any reliance on the information provided is entirely at your own risk. aiTrendview.com assumes absolutely no liability for any direct, indirect, incidental, consequential, financial, legal, trading, or other losses arising from the use of, reliance upon, or inability to use any content or data published. Nothing on this platform shall be construed as a solicitation, endorsement, or recommendation to buy, sell, hold, or speculate in any security, derivative, commodity, cryptocurrency, or financial instrument. All intellectual property, including but not limited to algorithms, report structures, proprietary formats, branding, and system outputs, is strictly protected under applicable intellectual property laws. Unauthorized reproduction, redistribution, modification, or commercial exploitation is strictly prohibited and may result in civil and criminal legal action.


