


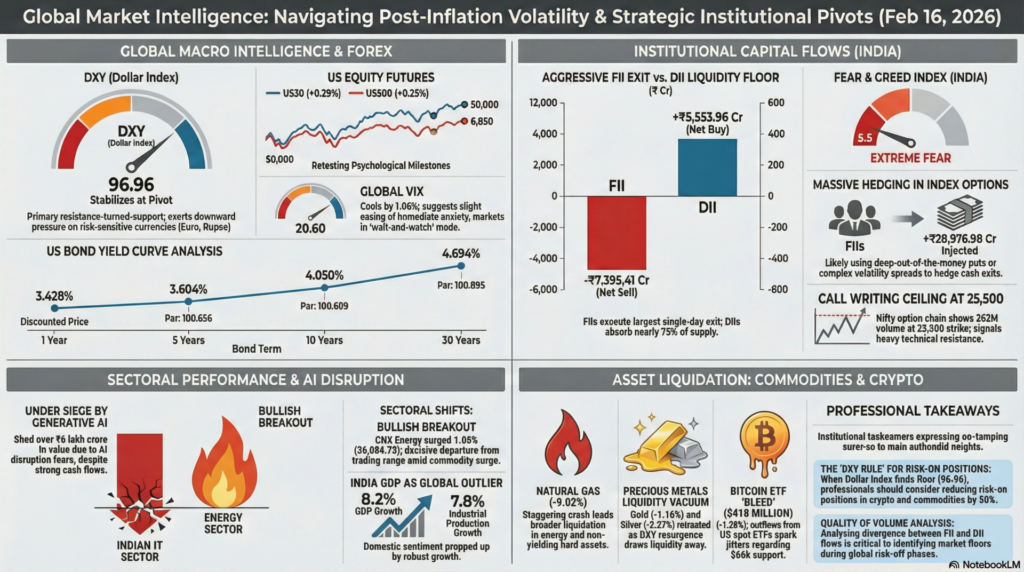
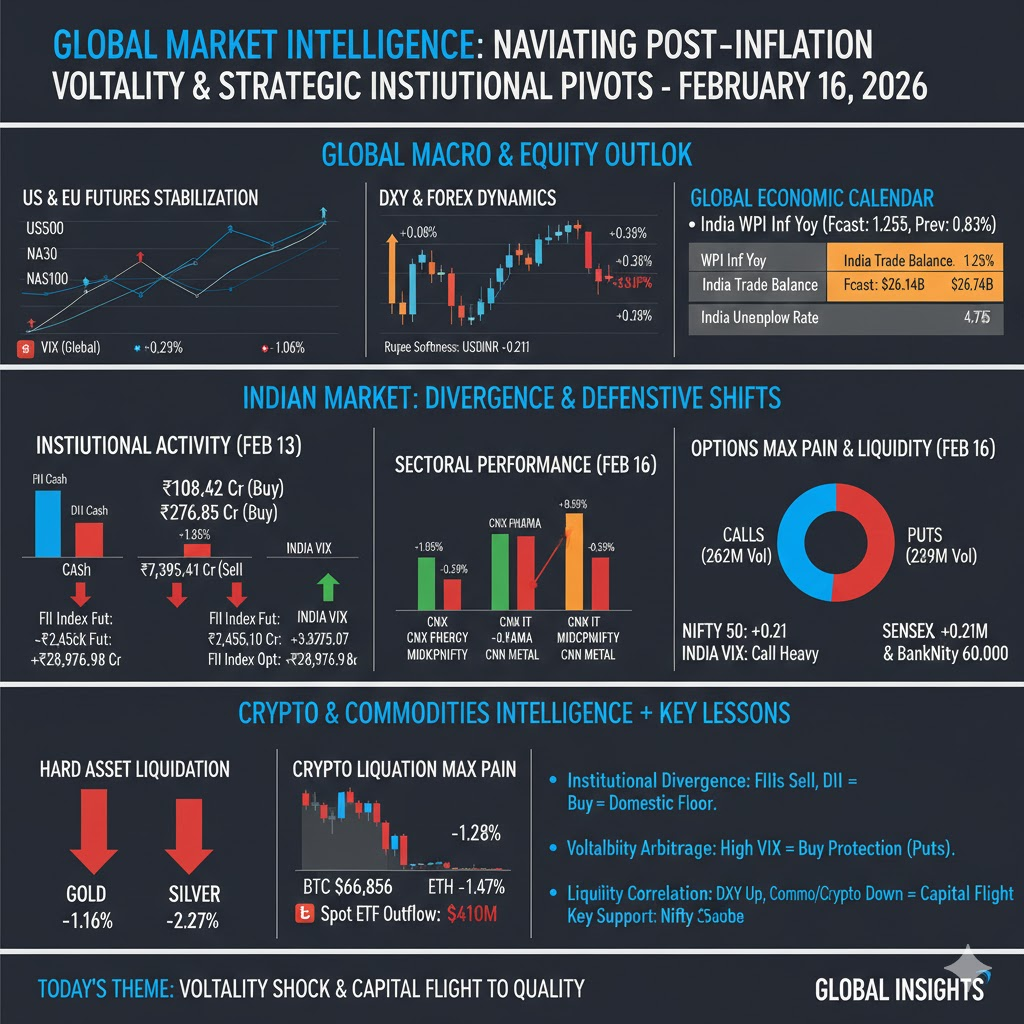
The global financial landscape on February 16, 2026, reflects a state of “High-Stakes Calibration” as major equity indices process recent inflationary data and shifting central bank rhetoric. In the Western markets, US futures showed resilience with the US30 and US500 gaining 0.29% and 0.25% respectively, signaling a cautious recovery after previous sessions of price discovery. European markets, however, remained fragmented; while the German DAX edged up 0.22%, the French CAC 40 dipped by 0.35%, indicating a continent-wide struggle between industrial resilience and persistent luxury-sector headwinds. This collective plateauing suggests that global investors are currently in a “wait-and-watch” mode, closely monitoring the Dollar Index (DXY) as it stabilizes near the 96.96 level, acting as a critical pivot for risk appetite.
In the Indian domestic market, the narrative is one of “Defensive Consolidation” as the benchmark Nifty 50 and Sensex both recorded marginal gains of approximately 0.2%, holding near psychological support zones. Despite the slight upward movement, the India VIX marginally rose by 1.20% to reach 13.45, suggesting that underlying fear and uncertainty remain persistent among local participants. Institutional activity has taken a decisively defensive turn; Foreign Institutional Investors (FIIs) executed a massive net sell of -₹7,395.41 Crores in the cash market, the largest single-day outflow of the month. This institutional flight to safety was partially offset by Domestic Institutional Investors (DIIs), who provided a liquidity cushion with a net buy of +₹5,553.96 Crores, highlighting a stark divergence in sentiment between global and domestic capital.
| Instrument | Price / Rate | Day Change (%) | Technical Movement | Key Event / Driver |
| US500 | 6,845.2 | +0.25% | Retesting 6,850 Pivot | Stabilization Efforts |
| US30 | 49,572.00 | +0.29% | Consolidating below 50k | Blue-chip Resilience |
| NAS100 | 24,750.2 | +0.22% | Sideways Churn | Tech Growth Pivot |
| DXY | 96.965 | +0.08% | Finding Floor Support | Dollar Index Recovery |
| VIX (Global) | 20.60 | -1.06% | Cooling Fear Gauge | Easing Global Anxiety |
| EURUSD | 1.1862 | -0.03% | Bearish Pressure | Euro Softness |
| USDJPY | 153.17 | +0.36% | Mean Reversion | Yen Softness |
| USDINR | 90.6975 | +0.21% | Rupee Softness | DXY Resurgence |
Technical Analysis: Global futures are exhibiting a “sideways-to-positive” bias as the US30 leads a modest recovery attempt toward the 50,000 psychological mark. The Dollar Index (DXY) is showing signs of stabilization at 96.96, which is currently acting as a primary resistance-turned-support, exerting downward pressure on risk-sensitive currencies.
Fundamental Analysis: The overarching fundamental theme is the recalibration of monetary expectations following recent US Core CPI data. The slight uptick in USDJPY (+0.36%) and USDINR (+0.21%) suggests a renewal of US Dollar strength as investors seek safety within the G10 basket, anticipating a “Higher for Longer” stance from the “Warsh Fed”.
Economic Announcements: The Indian economic calendar is top-heavy with the WPI Inflation Rate (YoY), forecasted at a significant jump to 1.25% from the prior 0.83%. Simultaneously, India’s Balance of Trade is projected to widen to -$26.14 Billion, which may influence the RBI’s “Hawkish Pause” stance in the upcoming cycle.
| Index / Sector | Last Price | Day Change (%) | Technical Movement | Event / Driver |
| NIFTY 50 | 25,525.70 | +0.21% | Holding 25,500 Floor | Volatility Resistance |
| SENSEX | 82,803.17 | +0.21% | Mean Reversion | Large-cap Stability |
| BANKNIFTY | 60,367.85 | +0.30% | Outperforming Benchmark | HDFC Bank Bids |
| INDIA VIX | 13.45 | +1.20% | Consolidation at Base | Low Fear Plateau |
| CNX ENERGY | 36,084.75 | +1.05% | Bullish Breakout | Commodity Surge |
| CNX FMCG | 51,070.50 | +0.33% | Defensive Rotation | Inflation Hedge |
| CNX PHARMA | 22,384.35 | +0.85% | Safe Haven Buying | Sectoral Strength |
| MIDCPNIFTY | 13,577.40 | -0.39% | Profit Booking | Small-cap De-leveraging |
Technical Analysis: The Nifty 50 is currently attempting to establish a firm base above the 25,500 psychological milestone after recent volatility. A major technical highlight is the CNX Energy sector’s 1.05% surge, marking a decisive breakout from its recent trading range, while the IT sector (-0.51%) continues to act as a drag on broader indices.
Fundamental Analysis: Domestic sentiment is being propped up by stable interest rate expectations, with India’s GDP growth remains a global outlier at 8.2%. Robust industrial production (+7.8%) and a controlled unemployment rate (4.8%) underpin the fundamental health of the domestic economy, despite the massive FII sell-off.
Economic Announcements: US Fed official Bowman’s upcoming speech is being closely watched for signals regarding the labor market’s resilience. Domestically, the market is adjusting to a slightly higher forecasted unemployment rate of 4.75%, which remains within healthy thresholds.
| Segment | Net Buy/Sell (Cr) | Action Bias |
| FII Cash Market | -7,395.41 | Aggressive Exit |
| DII Cash Market | +5,553.96 | Liquidity Floor |
| FII Index Futures | -2,455.10 | Directional Short |
| FII Index Options | +28,976.98 | Massive Hedging |
| FII Stock Futures | -3,273.07 | Tactical Selling |
| Index | ATM Strike | Put Volume (Max) | Call Volume (Max) | Market Sentiment |
| NIFTY | 25,500 | 229,140,405 | 262,413,775 | Call Writing Heavy |
| BANKNIFTY | 60,400 | 935,640 | 1,032,210 | Resistance Base |
Technical Analysis: The Nifty option chain indicates a massive concentration of Call writing at the 25,500 strike (262M volume), suggesting that traders view this level as a primary immediate ceiling. However, the FII net long position in options (+₹28,976 Cr) indicates they are buying deep-out-of-the-money puts or complex volatility spreads to hedge their massive cash exits.
Fundamental Analysis: Institutional rebalancing is at an extreme; the -₹7,395 Cr FII exit suggests a strategic reallocation of global portfolios out of Emerging Markets as US 10Y yields remain high at 4.05%. DIIs, conversely, are providing the “liquidity floor,” absorbing nearly 75% of the FII supply in the cash segment.
Economic Announcements: Foreign Exchange Reserves at $723.77 Billion remain the primary fundamental shield for the RBI to defend the Rupee against aggressive speculative pressure from global dollar strength.
| Instrument | Price | Day Change (%) | Technical Status | Headline Sentiment |
| Bitcoin (BTC) | $66,856 | -1.28% | Testing $66k Support | ETF Outflow Jitters |
| Ethereum (ETH) | $1,956.8 | -1.47% | Bearish Pressure | Regulatory Headwinds |
| GOLD (XAUUSD) | $4,984.24 | -1.16% | Liquid Phase | Safe Haven Distribution |
| SILVER | $75.58 | -2.27% | Momentum Correction | Industrial Fatigue |
| NATGAS | $3.492 | -9.02% | Sharp Breakdown | Oversupply Woos |
Technical Analysis: Commodities are seeing a severe “Liquidation Wave” today, led by a staggering 9.02% crash in Natural Gas. Both Gold and Silver have staged a sharp retreat, losing -1.16% and -2.27% respectively, as the resurgence of the Dollar Index (DXY) creates a “Liquidity Vacuum” in non-yielding hard assets.
Fundamental Analysis: The crypto market is undergoing a period of “Max Pain,” with Bitcoin slipping 1.28% as US spot Bitcoin ETFs reported a combined $410 million bleed. Standard Chartered has slashed its BTC target, citing a potential slide to $50,000 if critical support at $75,000 (SOL) remains broken.
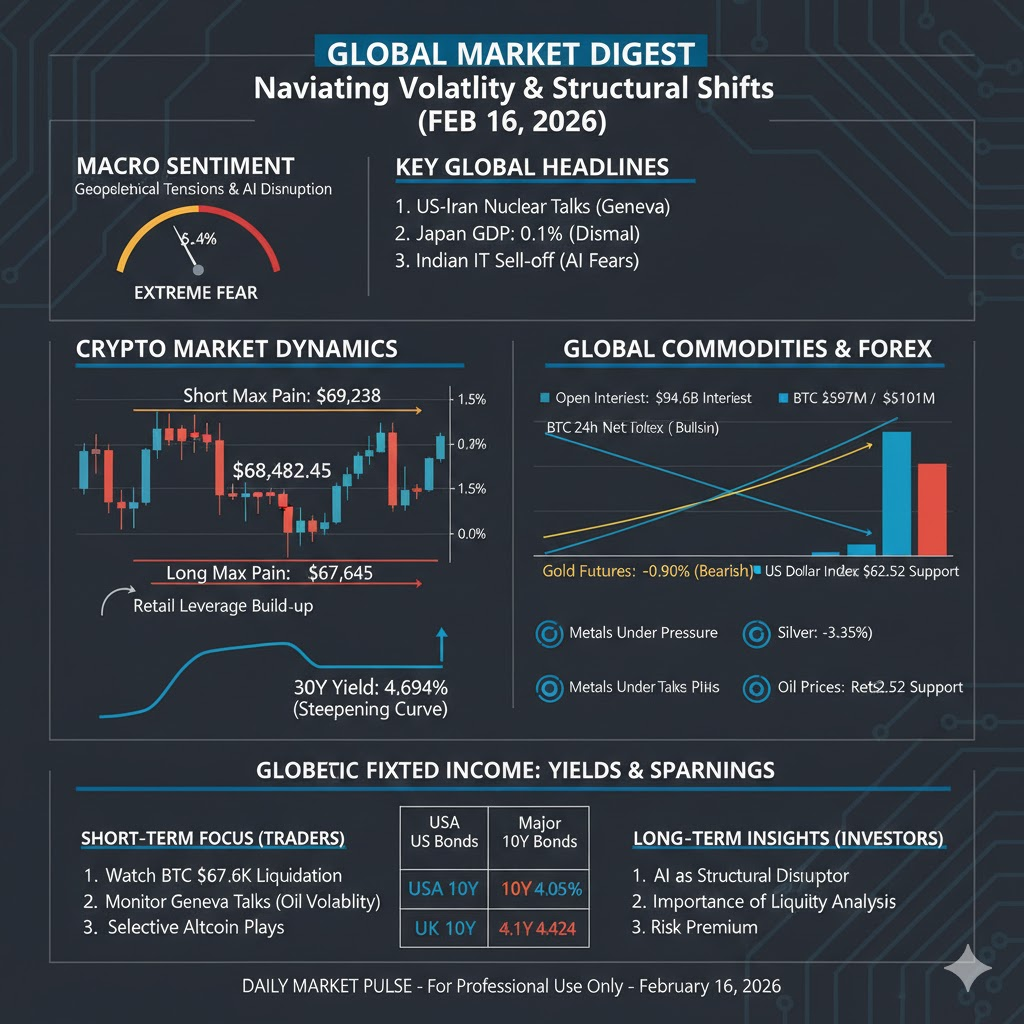
Economic Announcements: US CPI data remains the master trigger; headlines suggest today’s inflation report could decide whether Bitcoin breaks $70k or drops toward $60k. Simultaneously, the Baker Hughes Total Rigs Count standing at 551 indicates steady production levels, which is keeping a lid on any potential energy price recovery.
The global financial landscape is characterized by a “wait-and-see” approach today as thin holiday trading and significant geopolitical developments anchor market sentiment. Major centers including China, South Korea, Taiwan, and the United States are closed, leading to subdued activity across currencies and bonds. Despite the quiet, underlying tension is palpable as traders focus on the Geneva nuclear talks between the U.S. and Iran, which are directly influencing energy pricing and regional stability. Meanwhile, dismal GDP data from Japan, showing a mere 0.1% annualized growth, has dampened Asian outlooks and increased pressure for aggressive fiscal stimulus.
In the technology and digital asset space, a massive sell-off in Indian IT stocks—shedding over ₹6 lakh crore in value—highlights growing fears that generative AI may fundamentally disrupt traditional outsourcing models. While sector giants attempt to pivot, the Nifty IT index remains under heavy pressure. Simultaneously, the cryptocurrency market is navigating its own volatility; Bitcoin has retraced from previous highs to hover near $68,000 as leverage begins to build once more. This combination of macroeconomic stagnation in Japan, AI-driven structural shifts in India, and high-stakes diplomacy in Geneva creates a complex environment for market participants.
| Symbol | Price (USD) | 24h Change | Market Cap | Short Max Pain | Long Max Pain |
| Bitcoin (BTC) | 68,482.45 | -0.45% | 1.37 T | $69,238.84 | $67,645.88 |
| Ethereum (ETH) | 1,959.90 | -0.28% | 236.48 B | $1,989.58 | $1,920.69 |
| XRP (XRP) | 1.4593 | -1.04% | 88.9 B | $1.5072 | $1.4316 |
| Solana (SOL) | 84.78 | (N/A) | (N/A) | $87.054 | $84.13 |
Technical Analysis: Bitcoin is exhibiting a sideways trend, trading between a range of $62,000 and $71,000 since early February. A build-up in retail leverage suggests an impending volatile move, with “Long Max Pain” at $67,645 acting as a critical support level to avoid mass liquidations.
Fundamental Analysis: Sentiment is cautious as major figures like Michael Saylor signal further buys amid a broader market rout, while debates over technical fixes like BIP-110 Ordinals continue to divide the community. Total Bitcoin Open Interest has dipped slightly (-2.79% in 24h), indicating a cooling off period following recent shorts liquidation events.
Economic Announcements: Global market closures for Lunar New Year and thin liquidity are the primary drivers today, preventing a meaningful breakout attempt for major tokens.
| Instrument | Price | Change (%) | Movement | Key Event |
| Gold Futures | 5,001.1 USD | -0.90% | Bearish | Profit-taking in thin trading |
| Silver Futures | 75.355 USD | -3.35% | Bearish | Holiday-hit trading volatility |
| US Dollar Index | 96.974 USD | +0.09% | Bullish | Stable amid thin holiday trade |
| EUR to USD | 1.18620 USD | -0.03% | Neutral | Becalmed by market holidays |
Technical Analysis: Metals are under fresh pressure, with Gold dropping over 1% earlier today as investors engage in profit-taking during low-volume sessions. The US Dollar Index (DXY) remains steady at 96.97, maintaining a slight upward bias.
Fundamental Analysis: The US-Iran nuclear talks in Geneva are the central fundamental driver for energy and related commodities. Oil prices are retesting support at $62.52 per barrel as traders brace for diplomatic outcomes that could alter global supply dynamics.
Economic Announcements: Dismal Japan GDP data (0.1% growth) has weakened the Yen’s outlook, though domestic interest rate shifts have yet to halt speculative selling against the Euro.
| US Bond Term | Price (% of Par) | Yield | Major 10Y Bonds | Yield |
| 1 Year | 3.302 (Disc.) | 3.428% | USA 10Y | 4.050% |
| 5 Years | 100.656 | 3.604% | UK 10Y | 4.424% |
| 10 Years | 100.609 | 4.050% | Germany 10Y | 2.763% |
| 30 Years | 100.895 | 4.694% | Italy 10Y | 3.400% |
Technical Analysis: US Treasury yields saw a slight decline at the end of last week following cooler-than-expected inflation data, providing a platform for the current consolidation. Long-term 30-year yields are significantly higher at 4.69%, indicating an upward-sloping yield curve.
Fundamental Analysis: Concerns over AI-led disruption in major economies are competing with inflation data to drive bond sentiment. In India, tighter capital market lending norms from the RBI have caused local financial shares to open lower, impacting regional bond sentiment.
Economic Announcements: Investors are looking ahead to Friday’s global manufacturing surveys and the US fourth-quarter GDP report for the next major directional catalyst.
For training and learning purposes, this market session highlights the profound impact of liquidity gaps and structural fears. When major markets like the US and China close, price discovery becomes fragile, making technical levels—such as the “Max Pain” points in crypto or the support levels in Oil—far more significant than usual. Traders should learn to recognize that thin volume often leads to exaggerated movements in commodities, as seen in the sharp 3.35% drop in Silver today.
Furthermore, the AI-driven sell-off in the Indian IT sector serves as a vital case study in “Future-Proofing” analysis. It demonstrates how long-term structural threats can outweigh current fundamental strength (like low P/E ratios or strong cash flow), causing immediate capital flight. Understanding the interplay between geopolitical events (Geneva talks) and economic data (Japan’s GDP) is essential for a holistic view of global risk management.
For educational and training purposes, today’s session serves as a masterclass in Institutional Divergence & Liquidity Cushions. The -₹7,395.41 Crore exit by FIIs alongside the +₹5,553.96 Crore absorption by DIIs demonstrates how domestic institutions have become the “Volatility Dampeners” of the modern Indian market. For a trainee trader, this underscores the importance of not just watching the benchmark price, but analyzing the “Quality of Volume.” When FIIs sell aggressively, it typically signals a global macro shift (such as rising US yields), whereas strong DII buying signals domestic structural confidence. Mastering the relationship between these two flows is essential for identifying potential market floors during global risk-off phases.
Secondly, the “Max Pain” in Digital Assets and Commodities observed today provides a key lesson in “Liquidity Correlation.” The simultaneous crash in Natural Gas (-9.02%) and the $410M bleed in Bitcoin ETFs teaches us that during “Dollar Resurgence” sessions, capital is agnostic—it flees anything that is not cash. For a professional trader, the takeaway is clear: when the Dollar Index (DXY) finds a floor (as it did at 96.96), your “Risk-On” positions in crypto and commodities must be reduced by 50% immediately. Use the “Fear & Greed Index” (currently at 8 – Extreme Fear) not as a reason to buy the dip, but as a warning of extreme illiquidity where price can gap down significantly without warning.
Legal Disclaimer & Liability Waiver
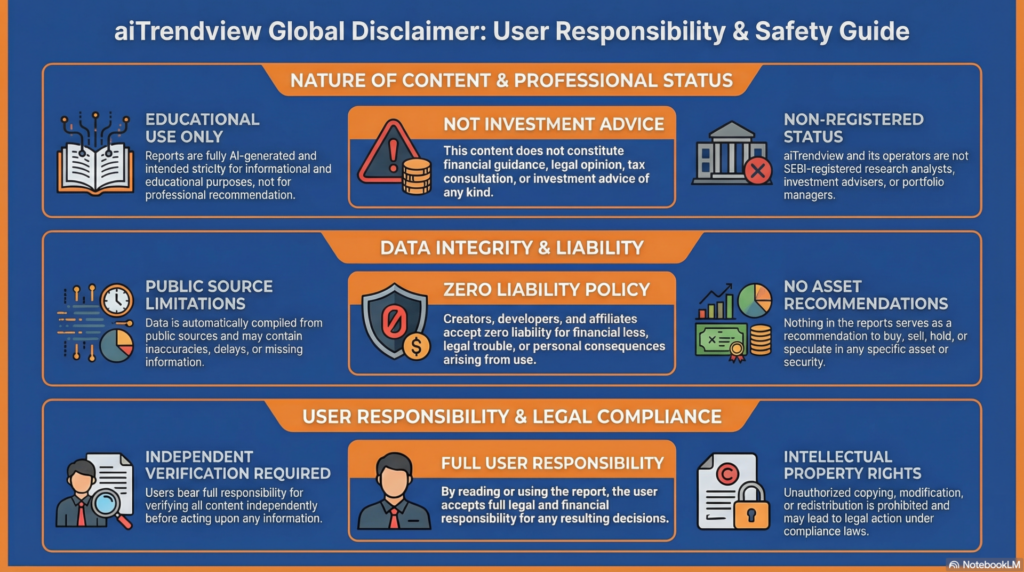
This AI-generated report is strictly educational and does not constitute financial, legal, or professional advice. aiTrendview and its affiliates are not SEBI-registered advisors and assume zero liability for any losses or consequences resulting from its use. All data is autonomously harvested from public sources and may be flawed, delayed, or incomplete; therefore, you assume exclusive responsibility for independently verifying information before taking any action. Under no circumstances should this content be construed as a recommendation to trade or speculate in any security. By accessing this material, you acknowledge that any reliance on this data is at your sole risk, and you agree to be bound by strict intellectual property protections prohibiting the unauthorized redistribution or modification of this work.