


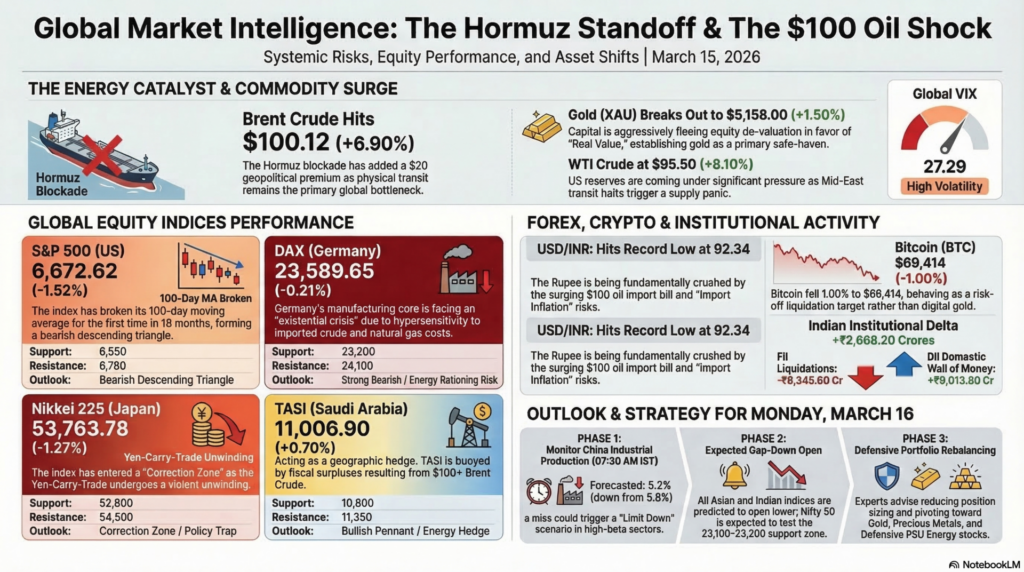
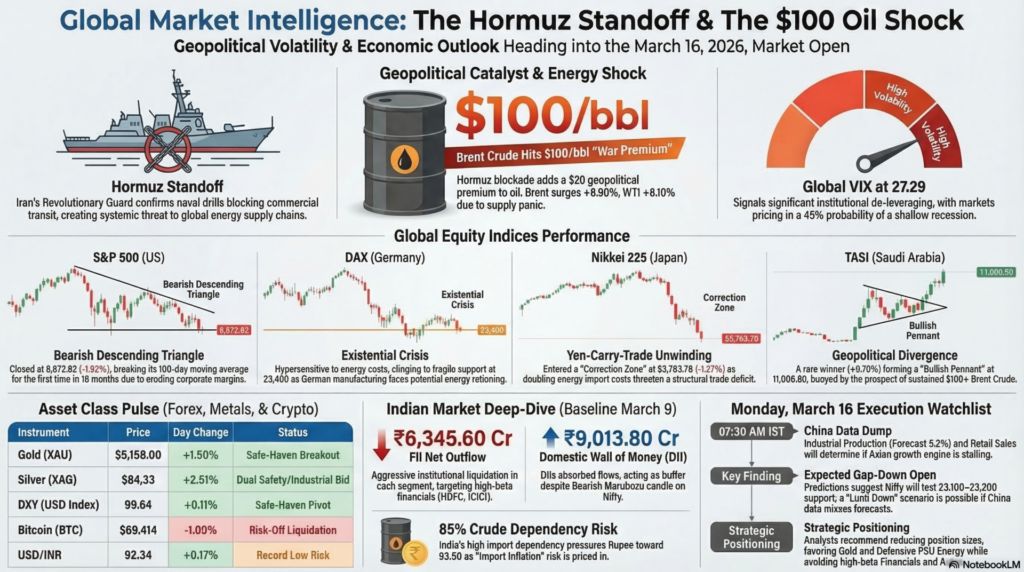
On this Sunday, March 15, 2026, the global financial community is in a state of suspended animation, awaiting the high-stakes open on Monday. The “shadow” markets and weekend geopolitical updates from the Gulf suggest that the Strait of Hormuz blockade remains the singular force-multiplier for global volatility. While diplomatic backchannels are reportedly active, the physical reality of naval deployments has kept the “War Premium” in energy prices firmly entrenched near $100/bbl. This energy shock is no longer just a supply concern; it is a systemic threat to global inflation targets, specifically for major importers like India, Japan, and the Eurozone. Monday’s session will be defined by the “China Data Dump” (Industrial Production and Retail Sales), which will determine if the Asian growth engine is stalling under the weight of these exogenous shocks.
The S&P 500 enters the week at a critical technical juncture, having closed Friday at 6,672.62 (-1.52%), effectively breaking below its 100-day moving average for the first time in eighteen months. This breakdown is fundamentally driven by a “Stagflationary Pincer,” where surging energy costs are expected to erode Q1 2026 corporate margins while the Federal Reserve remains constrained by “sticky” inflation data. Technically, the index has formed a bearish descending triangle, with the Global VIX at 27.29 signaling that institutional de-leveraging is far from over. Resistance is now firmly established at 6,780, a level that formerly acted as a support floor but now represents a formidable ceiling for any relief rally. Fundamentally, the market is pricing in a 45% probability of a shallow recession by year-end as the “Higher for Longer” yield narrative gains renewed momentum. Support is currently projected at the 6,550 level, which aligns with the November 2025 swing lows. Any breach below this mark could trigger a cascade of systematic selling from algorithmic funds. Traders are currently favoring absolute cash positions and short-duration Treasuries as a temporary bunker. The focus for Monday will be the NY Empire State Manufacturing Index to gauge the resilience of the domestic industrial base.
Europe’s leading benchmark, the DAX, is facing an existential fundamental crisis, ending the week at 23,589.65 (-0.21%) while underperforming its global peers in real terms. The index is the primary victim of the Middle Eastern energy chokepoint, as Germany’s manufacturing core is hypersensitive to the price of natural gas and imported crude. Technically, the DAX is clinging to a fragile structural support at 23,400, but the volume profile suggests a lack of conviction from long-term institutional buyers. Fundamental analysis suggests a severe re-rating of chemical and automotive sectors as input costs balloon, making German exports less competitive in the global market. Immediate support is pegged at 23,200, a level that has not been tested since the early volatility of Q3 2025. Resistance is positioned at 24,100, where significant call writing is visible in the March monthly derivatives series. The ECB is currently trapped between a deteriorating growth outlook and the need to defend the Euro against energy-driven depreciation. Monday’s open will be a test of whether European sovereign wealth funds will intervene to provide a liquidity floor. For now, the sentiment remains “Strong Bearish” as the region braces for potential energy rationing in a worst-case scenario. Professional analysts are advising a reduction in high-beta industrial exposure in favor of defensive utilities and healthcare.
Japan’s Nikkei 225 has retreated into a “Correction Zone,” closing at 53,763.78 (-1.27%) as the Yen-Carry-Trade undergoes a violent unwinding. The index is fundamentally squeezed by the doubling of energy import costs, which threatens to flip Japan’s trade balance into a structural deficit. Technically, the index has formed a bearish gap-down on the daily chart, and the RSI has entered the 35 zone, suggesting that while oversold, the momentum remains firmly downward. Support is currently stationed at 52,800, while any rebound will face an aggressive resistance cluster near the 54,500 mark. Fundamentally, the Bank of Japan is in a “Policy Trap,” unable to tighten interest rates to support the Yen without further crashing an equity market already reeling from the Hormuz shock. The market is closely watching the 10-year JGB yield, which has crept toward 1.1%, further tightening financial conditions for corporate Japan. Monday’s session will be heavily influenced by the China Industrial Production data, which acts as a lead indicator for Japanese machinery and component exports. Defensive posturing is highly recommended, with a specific focus on the yen-denominated safe-haven bid. Traders are liquidating long positions in consumer tech and pivoting toward large-cap banks which might benefit from a potential rate hike. The sentiment is “Neutral-Bearish,” with a high probability of a gap-down open on Monday.
The Saudi Tadawul (TASI) continues to exhibit a “Geopolitical Divergence,” acting as a rare global winner in a high-volatility energy regime. The index closed the week at 11,006.90 (+0.70%), fundamentally buoyed by the prospect of $100+ Brent Crude boosting the fiscal surpluses of the Kingdom. Technically, the TASI is one of the few global indices trading above its 50-day and 200-day moving averages, forming a “Bullish Pennant” that suggests further upside if the oil blockade persists. Support is firmly established at 10,800, while resistance is projected at the 11,350 multi-year high. Fundamental analysis suggests that Saudi Aramco and SABIC are primary beneficiaries of the current supply shock, providing a robust earnings cushion that offsets global growth concerns. However, the proximity to the military theater in the Gulf remains a “Tail Risk,” as any direct infrastructure strikes would trigger an immediate de-leveraging. Monday’s open will track the weekend’s naval developments in the Gulf; if transit remains blocked, the energy sector will likely lead the index to new heights. Professionals are using the TASI as a geographic hedge against the stagflationary decay visible in Western and Asian markets. The outlook remains “Bullish-Contingent,” provided that local energy assets remain physically secured.
| Instrument | Live/Close Price | Day Change (%) | Support | Resistance | Tech/Fund Analysis |
| DXY (USD Index) | 99.64 | +0.11% | 99.00 | 100.20 | Safe-Haven Pivot. Dollar dominance persists amid global fragmentation. |
| USD/INR | 92.34 | +0.17% | 91.80 | 93.50 | Record Low Risk. Fundamentally crushed by the $100 oil import bill. |
| Bitcoin (BTC) | $69,414 | -1.00% | $66,500 | $74,500 | Risk-Off Liquidation. BTC is behaving as a high-beta asset rather than digital gold. |
| Ethereum (ETH) | $1,945 | -0.40% | $1,850 | $2,050 | Liquidity Drain. On-chain activity stalling as gas fees spike on ETH. |
| Brent Crude | $100.12 | +6.90% | $95.00 | $115.00 | Parabolic Surge. Hormuz blockade has added a $20 geopolitical premium. |
| WTI Crude | $95.50 | +8.10% | $90.00 | $105.00 | Supply Panic. US reserves under pressure as Mid-East transit halts. |
| Commodity | Price | Day Change (%) | Support | Resistance | Technical/Fundamental Detail |
| Gold (XAU) | $5,158.00 | +1.50% | $5,050 | $5,300 | Safe-Haven Breakout. Capital fleeing equity de-valuation for “Real Value.” |
| Silver (XAG) | $84.33 | +2.51% | $80.00 | $90.00 | Dual Bid. Safety bid combined with industrial supply bottleneck. |
| Steel (HRC) | $1,060 | -0.19% | $1,020 | $1,100 | Logistics Drag. Higher freight costs are pass-through to end-users. |
| Iron Ore | $105.14 | +0.40% | $100.00 | $112.00 | China Focus. Monday’s industrial data will provide the next pivot. |
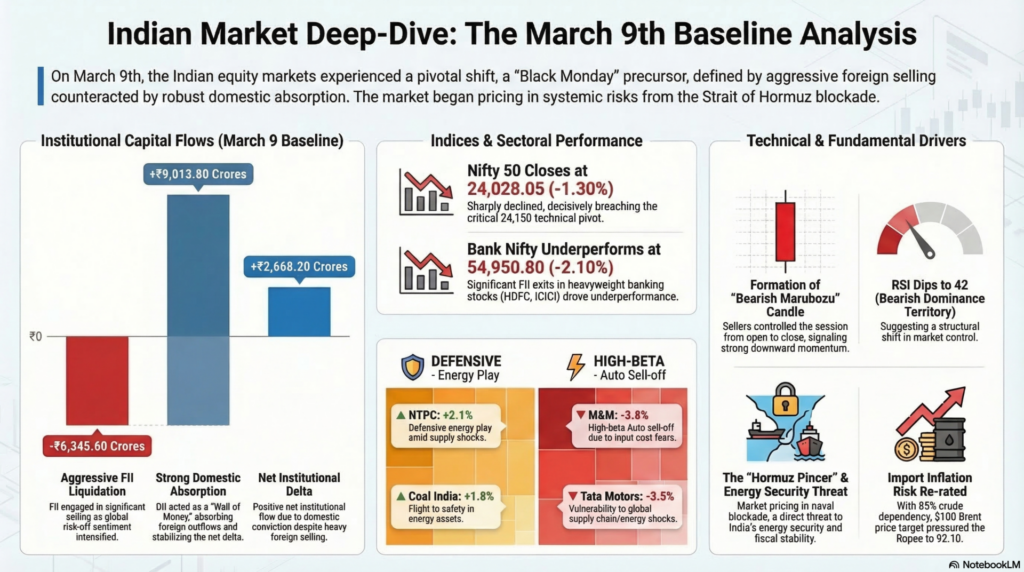
For research and comparative purposes, we reference the pivotal March 9th session, which served as the baseline for the current “Black Monday” trajectory.
Technical: On March 9th, the Nifty formed a “Bearish Marubozu” candle, indicating that sellers controlled the session from open to close. The RSI dipped to 42, signaling a transition from “Bullish Control” to “Bearish Dominance.”
Fundamental: The session was the first to fully price in the threat to the Strait of Hormuz. With India’s crude import dependency at 85%, the market fundamentally re-rated the “Import Inflation” risk, pressuring the Rupee to 92.10.
| Time (IST) | Country | Event | Forecast | Previous | Impact |
| 07:30 AM | China | Industrial Production (YoY) | 5.2% | 5.8% | Critical |
| 07:30 AM | China | Retail Sales (YoY) | 4.0% | 5.1% | High |
| 06:00 PM | Canada | CPI (YoY) | 2.1% | 2.2% | Medium |
| 06:45 PM | US | NY Empire State Mfg Index | -2.5 | 1.1 | Medium |
| 08:30 PM | US | 3-Month & 6-Month Bill Auctions | — | 3.61% | Medium |
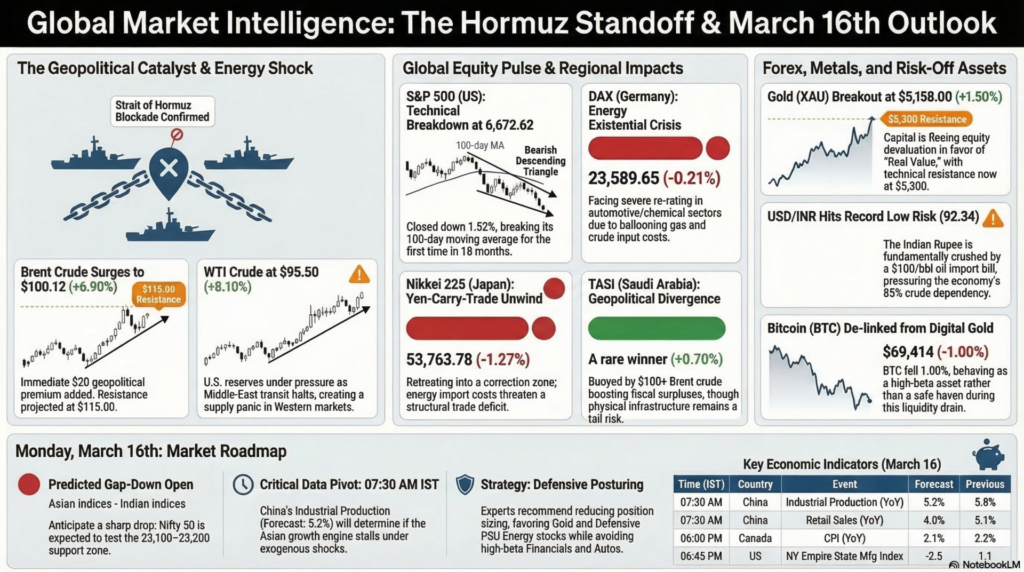
Latest from Dubai/Riyadh: * Hormuz Closure: Iran’s Revolutionary Guard has confirmed a second day of “Naval Drills” effectively blocking commercial transit through the Strait. UAE and Saudi officials have urged international intervention to secure the maritime corridor.
Prediction: Expect a Gap-Down Open for all Asian and Indian indices on Monday morning. The Nifty is likely to test the 23,100–23,200 support zone as it fills the technical gap left from the 2025 rally. If China’s Industrial Production (07:30 AM) misses the 5.2% forecast, we could see a “Limit Down” scenario in certain high-beta sectors.
Strategy: Reduce position sizing. Favor Gold/Precious Metals and Defensive PSU Energy stocks. Avoid high-beta Financials and Autos until the Brent-INR pincer eases.
Legal Disclaimer & Liability Waiver – aiTrendview.com
All content, reports, signals, analytics, forecasts, and materials published on aiTrendview.com are fully AI-generated outputs produced through automated systems with zero human research, manual validation, editorial review, or professional intervention. This platform does not provide financial, investment, trading, legal, tax, or professional advice of any kind. aiTrendview.com, its owners, affiliates, and associated entities are not registered with SEBI or any other regulatory authority as investment advisors, research analysts, brokers, or financial consultants. All data is autonomously aggregated from publicly available sources and algorithmic processes that may contain inaccuracies, delays, omissions, or technical errors. Users are solely and exclusively responsible for independently verifying all information before making any financial, legal, or commercial decisions.
By accessing or using this platform, you expressly acknowledge and agree that any reliance on the information provided is entirely at your own risk. aiTrendview.com assumes absolutely no liability for any direct, indirect, incidental, consequential, financial, legal, trading, or other losses arising from the use of, reliance upon, or inability to use any content or data published. Nothing on this platform shall be construed as a solicitation, endorsement, or recommendation to buy, sell, hold, or speculate in any security, derivative, commodity, cryptocurrency, or financial instrument. All intellectual property, including but not limited to algorithms, report structures, proprietary formats, branding, and system outputs, is strictly protected under applicable intellectual property laws. Unauthorized reproduction, redistribution, modification, or commercial exploitation is strictly prohibited and may result in civil and criminal legal action.