
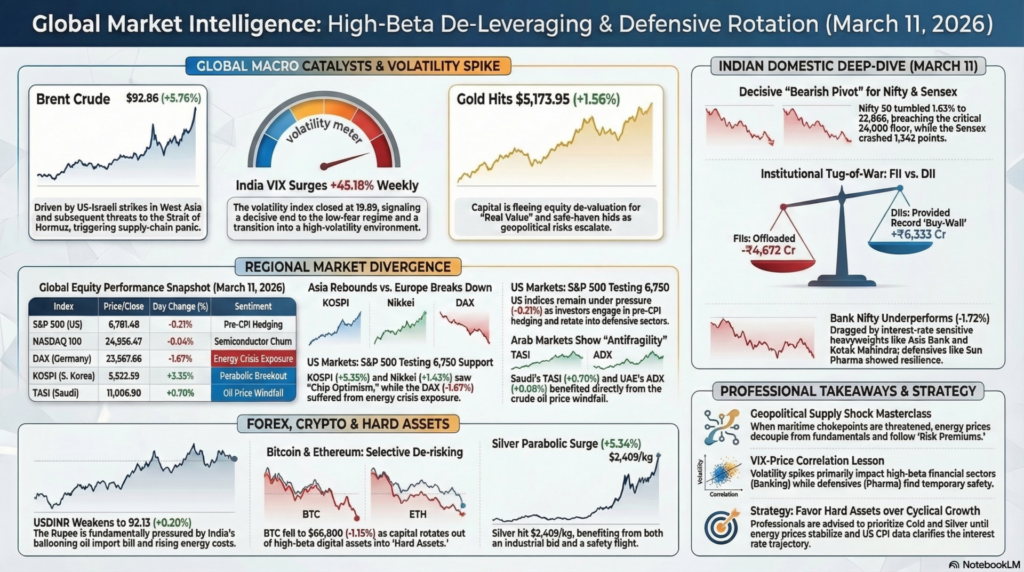
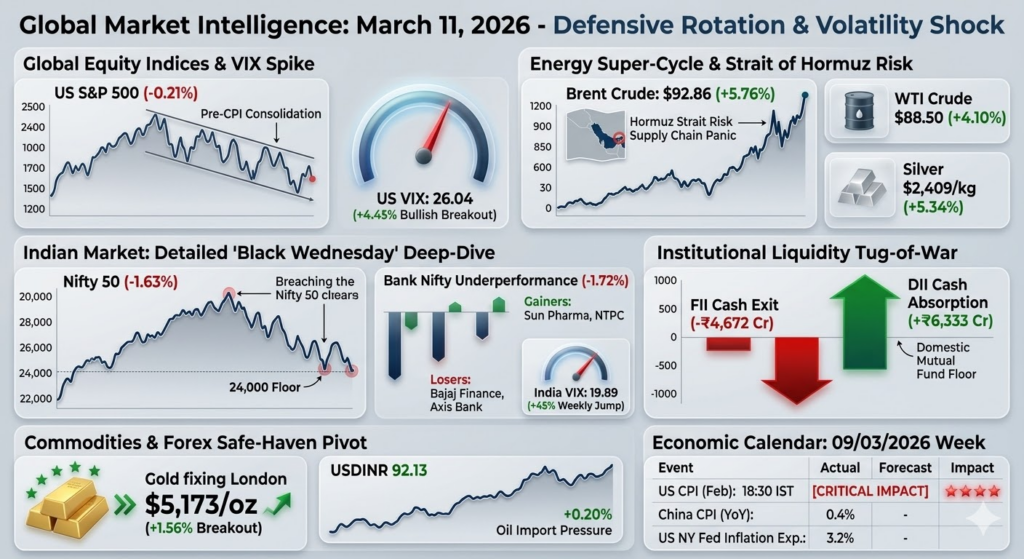
The global financial landscape on Wednesday, March 11, 2026, is currently navigating a period of intense “Volatility Expansion” as geopolitical escalations in West Asia collide with critical inflation data expectations. Markets are exhibiting a polarized performance; while Asian benchmarks like the Nikkei 225 (+1.43%) and KOSPI (+1.40%) managed to secure tactical rebounds following recent oversold conditions, Western futures and European indices are under significant pressure. The defining macro catalyst is the sharp spike in Brent Crude to $92.86 (+5.76%), which has reignited stagflationary fears and forced a rapid de-leveraging of risk-on assets into defensive safe havens like Gold and the US Dollar.
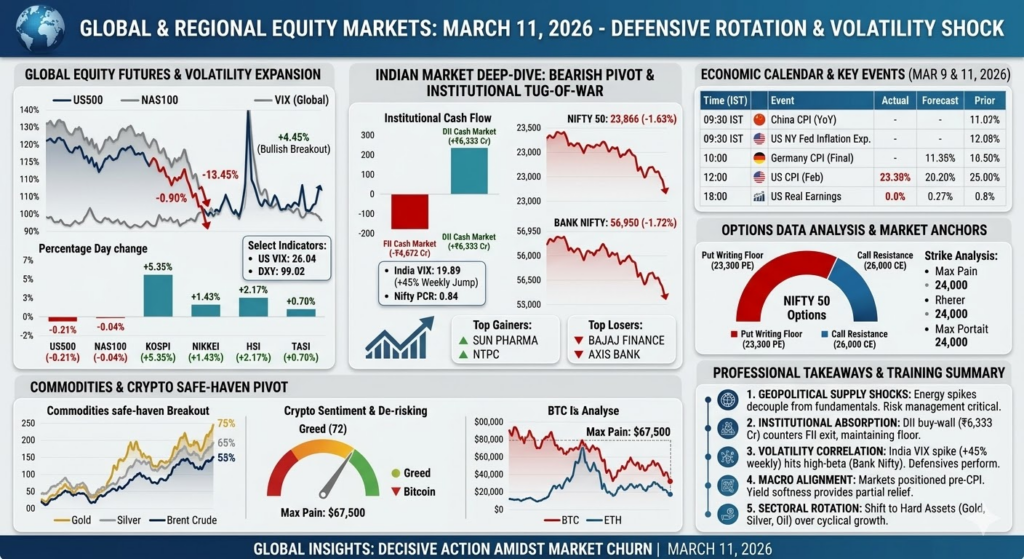
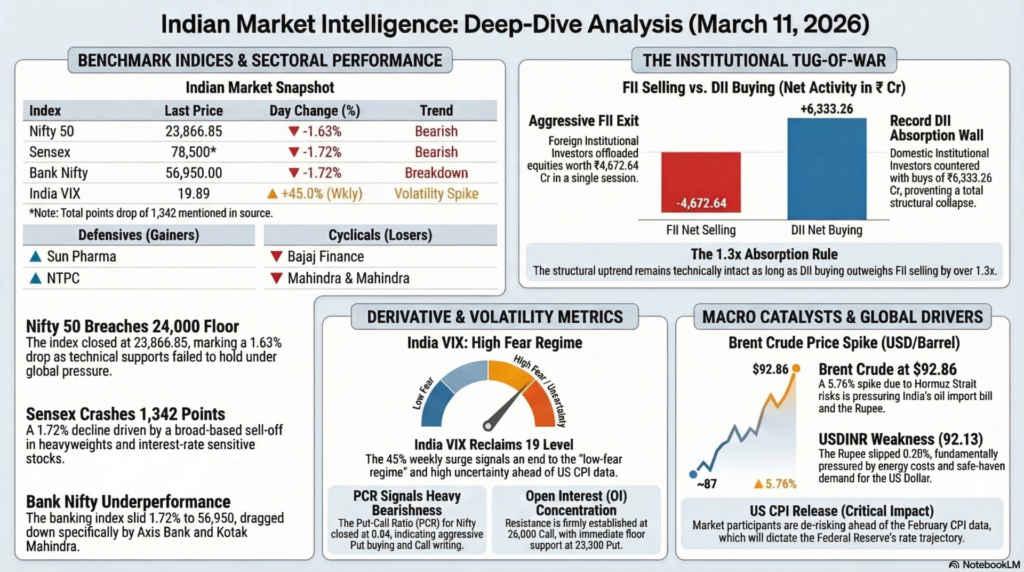
In the Indian domestic market, the session was marked by a decisive “Bearish Pivot” as the Nifty 50 tumbled 1.63% to 23,866 and the Sensex crashed 1,342 points (-1.72%). This correction was driven by a massive “Institutional Tug-of-War” where Foreign Institutional Investors (FIIs) offloaded equities worth ₹4,672 Cr, while Domestic Institutional Investors (DIIs) attempted to provide a liquidity cushion with buys of ₹6,333 Cr. Despite this absorption, the surge in the India VIX (+45.18% weekly) and the breakdown of banking heavyweights suggest that the market is bracing for a structural re-rating of domestic growth amid rising energy costs and a weakening Rupee (USDINR at 92.13).
| Index | Last Price | Day Change (%) | Technical Movement | Key Event / Driver |
| S&P 500 (US) | 6,781.48 | -0.21% | Testing 6,750 Support | Pre-CPI Hedging |
| Dow Jones | 47,706.51 | -0.07% | Sideways Neutral | Defensive Rotation |
| NASDAQ 100 | 24,956.47 | -0.04% | Testing 25,000 Pivot | Semiconductor Churn |
| VIX (US) | 26.04 | +4.45% | Bullish Breakout | High Fear Regime |
Technical Analysis: Global futures are entering a “High Volatility Regime” as the US VIX reclaimed the 26 level. The S&P 500 is currently testing a critical horizontal support at 6,750; a breach here could trigger a deeper correction toward 6,600. The NASDAQ remains resilient but faces a formidable technical resistance ceiling at 25,200.
Fundamental Analysis: The overarching theme is “Macro Fragmentation.” Investors are tactically reducing exposure in high-beta tech ahead of the US CPI release, which will dictate the Federal Reserve’s interest rate trajectory. The stabilizing Dollar Index (99.02) provides some protection for Western cash flows but pressures emerging market liquidity.
| Index | Price / Close | Day Change (%) | Technical Status | Headline Sentiment |
| NIKKEI 225 | 55,025.37 | +1.43% | Bullish Gap | Chip Optimism |
| KOSPI | 5,532.59 | +5.35% | Parabolic Breakout | Policy-driven Rally |
| Hang Seng | 25,959.90 | +2.17% | Bullish Rebound | China Trade Data |
| DAX (Germany) | 23,567.66 | -1.67% | Bearish Breakdown | Energy Crisis Exposure |
| ADX (UAE) | 10,005.42 | +0.08% | Neutral Bias | Safe Haven Bid |
| TASI (Saudi) | 11,006.90 | +0.70% | Bullish Pivot | Oil Price Windfall |
Research Report: Asia staged the session’s strongest rebound, led by South Korea’s KOSPI (+5.35%) as chip giants like SK Hynix and Samsung climbed over 8% following TSMC’s record revenue data. Conversely, Europe is facing a “Fundamental De-rating” as the DAX tumbled 1.67% due to its sensitivity to soaring energy costs and West Asia supply-chain risks. Arab markets like the TASI are showing “Antifragility,” gaining as they benefit directly from the crude oil super-cycle.
| Instrument | Price / Rate | Day Change (%) | Technical Support | Headline Driver |
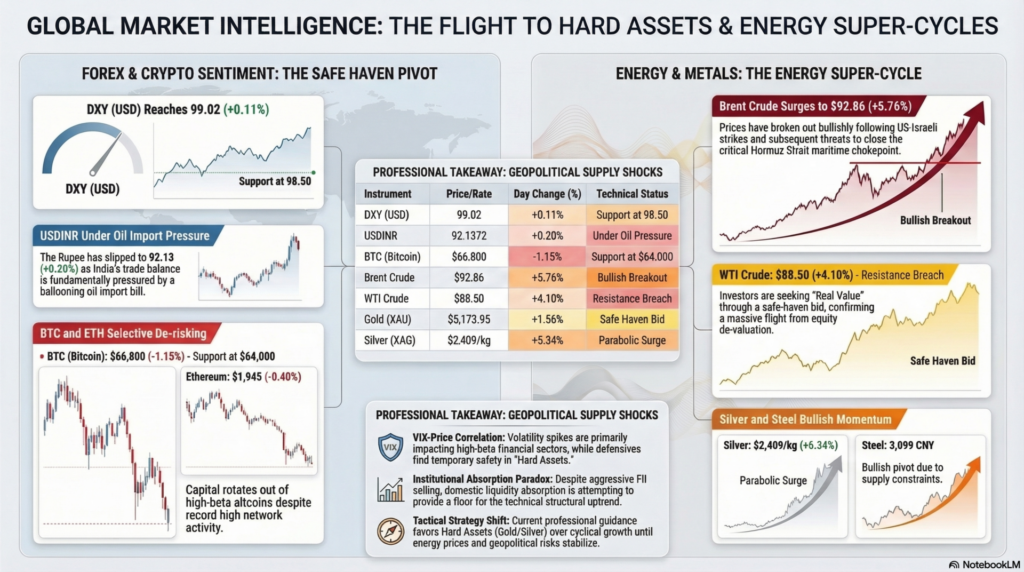
| DXY (USD) | 99.02 | +0.11% | 98.50 | Safe Haven Demand |
| USDINR | 92.1372 | +0.20% | 91.80 | Oil Import Pressure |
| BTC (Bitcoin) | $66,800 | -1.15% | $64,000 | Selective De-risking |
| ETH (Ethereum) | $1,945 | -0.40% | $1,850 | On-chain Liquidity Drain |
Analysis: Currency markets are dominated by the “Safe Haven Pivot.” The USDINR has slipped to 92.13, fundamentally pressured by India’s ballooning oil import bill. In the digital asset space, Ethereum network activity is at record highs, yet price lags (-0.40%) as capital rotates out of high-beta altcoins and into “Hard Assets”.
| Instrument | Price | Day Change (%) | Technical Status | Headline Sentiment |
| Brent Crude | $92.86 | +5.76% | Bullish Breakout | Hormuz Strait Risk |
| WTI Crude | $88.50 | +4.10% | Resistance Breach | Supply Chain Panic |
| Gold (XAU) | $5,173.95 | +1.56% | Safe Haven Bid | Bullish Momentum |
| Silver (XAG) | $2,409/kg | +5.34% | Parabolic Surge | Industrial/Safety Bid |
| Steel (Fe) | 3,099 CNY | +1.04% | Bullish Pivot | Supply Constraints |
Analysis: Commodities are in an “Energy Super-Cycle.” Brent Crude hitting $92.86 follows US-Israeli strikes on Iran and subsequent threats to close the Strait of Hormuz. Gold London Fixing at $5,173/oz confirms that capital is fleeing equity de-valuation for “Real Value”.
| Date | Time (IST) | Event / Data Release | Forecast | Previous | Impact |
| Mar 9 | 01:30 | China CPI (YoY) | 0.4% | 0.2% | Medium |
| Mar 9 | 19:30 | US NY Fed Inflation Exp. | 3.2% | 3.1% | High |
| Mar 11 | 12:30 | Germany CPI (Final) | 1.9% | 2.1% | Medium |
| Mar 11 | 18:30 | US CPI (Feb) | 3.1% | 3.1% | Critical |
| Mar 11 | 18:30 | US Real Earnings | — | — | Medium |
For educational and training purposes, today’s session serves as a masterclass in “Geopolitical Supply Shocks.” When a critical maritime chokepoint like the Strait of Hormuz is threatened, the price of energy decouples from economic fundamentals and follows “Risk Premiums” exclusively. For a trainee trader, the key lesson is the VIX-Price Correlation; the India VIX surging 45% weekly while Bank Nifty fell over 4% proves that volatility spikes primarily impact high-beta financial sectors while defensives like Pharma find temporary safety.
Secondly, the “Institutional Absorption Paradox” in India is evident. Despite ₹4,672 Cr of FII selling, DIIs provided a record ₹6,333 Cr buy-wall, effectively preventing a structural collapse of the technical floor at 23,500. For a professional analyst, the takeaway is absolute: as long as DII buying outweighs FII selling by over 1.3x, the structural uptrend remains technically intact, albeit under intense volatility. The strategy for the 09/03/2026 week is to favor Hard Assets (Gold/Silver) over cyclical growth until energy prices stabilize.
Legal Disclaimer & Liability Waiver – aiTrendview.com
All content, reports, signals, analytics, forecasts, and materials published on aiTrendview.com are fully AI-generated outputs produced through automated systems with zero human research, manual validation, editorial review, or professional intervention. This platform does not provide financial, investment, trading, legal, tax, or professional advice of any kind. aiTrendview.com, its owners, affiliates, and associated entities are not registered with SEBI or any other regulatory authority as investment advisors, research analysts, brokers, or financial consultants. All data is autonomously aggregated from publicly available sources and algorithmic processes that may contain inaccuracies, delays, omissions, or technical errors. Users are solely and exclusively responsible for independently verifying all information before making any financial, legal, or commercial decisions.
By accessing or using this platform, you expressly acknowledge and agree that any reliance on the information provided is entirely at your own risk. aiTrendview.com assumes absolutely no liability for any direct, indirect, incidental, consequential, financial, legal, trading, or other losses arising from the use of, reliance upon, or inability to use any content or data published. Nothing on this platform shall be construed as a solicitation, endorsement, or recommendation to buy, sell, hold, or speculate in any security, derivative, commodity, cryptocurrency, or financial instrument. All intellectual property, including but not limited to algorithms, report structures, proprietary formats, branding, and system outputs, is strictly protected under applicable intellectual property laws. Unauthorized reproduction, redistribution, modification, or commercial exploitation is strictly prohibited and may result in civil and criminal legal action.